Supply Chain Command Center
CLIENT
Manufacturing Leader
CLIENT
Manufacturing Leader
Team Composition
Lead UX Designer (me) Intermediate UX Designer
Team Composition
Lead UX Designer (me) Intermediate UX Designer
Time of Involvement
1 year 7 months
Time of Involvement
1 year 7 months
Led the discovery and implementation phase to gather many enterprise applications and business processes under one roof.
Challenge
Challenge
Challenge
How might we give supply chain managers one tool for all their processes so they can escape endless emails and scattered systems?
Design Solution
Design Solution
Design Solution
Connecting all enterprise applications under a single supply chain digital twin, which facilitates internal user operations with collaboration flows, with a layer of advanced analytics, alerts, and risk mitigation.
Approach
Approach
Approach
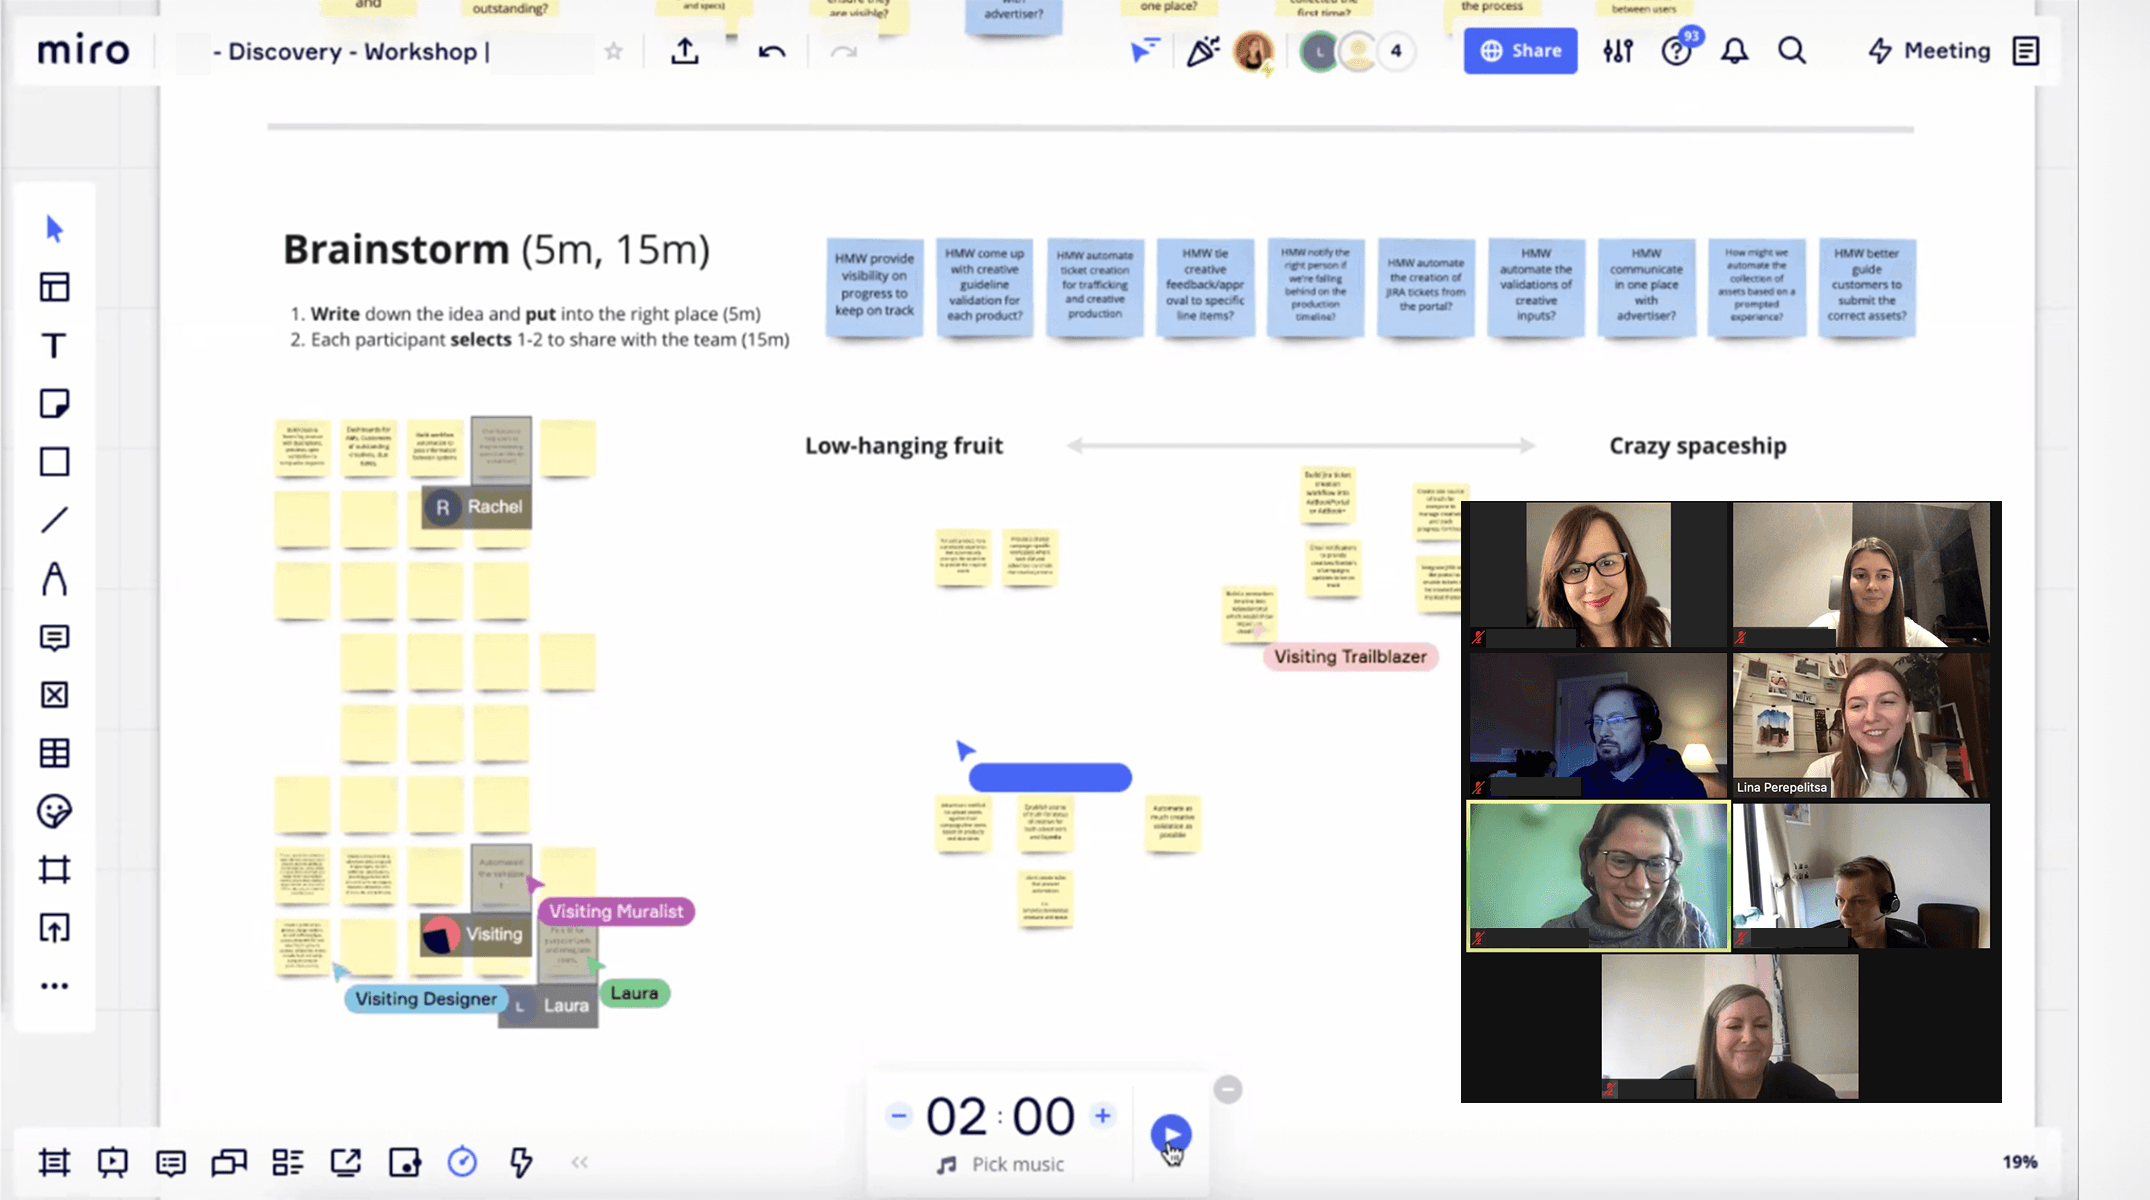
01
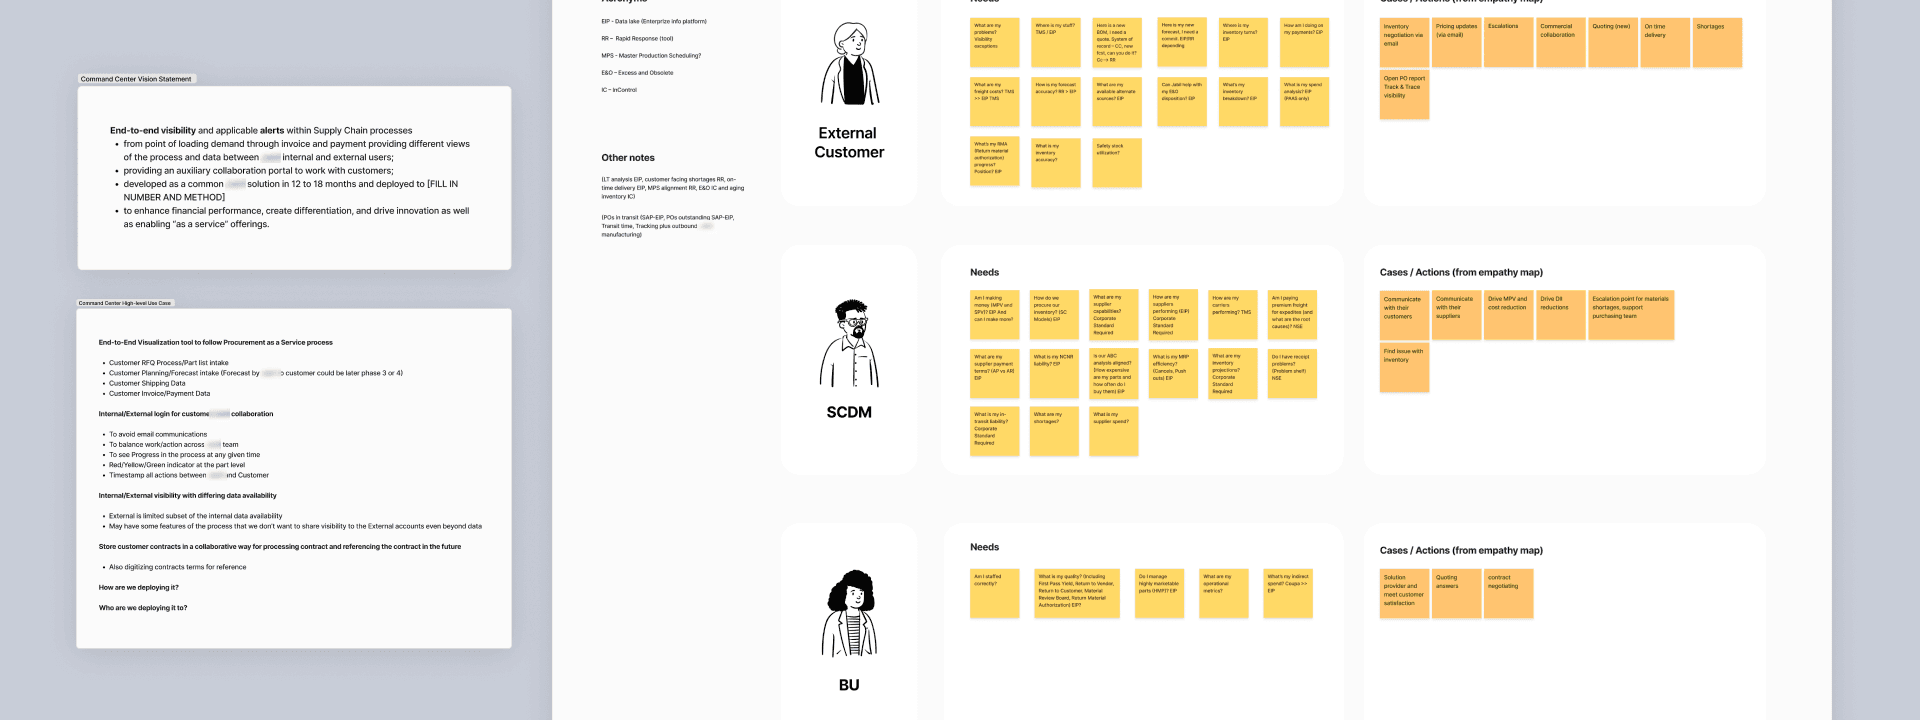
Strategic Workshops
As a first step, we aligned on the current product vision — clarifying why we’re building it, who the primary users are, and what value it should deliver.
01
Strategic Workshops
As a first step, we aligned on the current product vision — clarifying why we’re building it, who the primary users are, and what value it should deliver.
01
Strategic Workshops
As a first step, we aligned on the current product vision — clarifying why we’re building it, who the primary users are, and what value it should deliver.
02
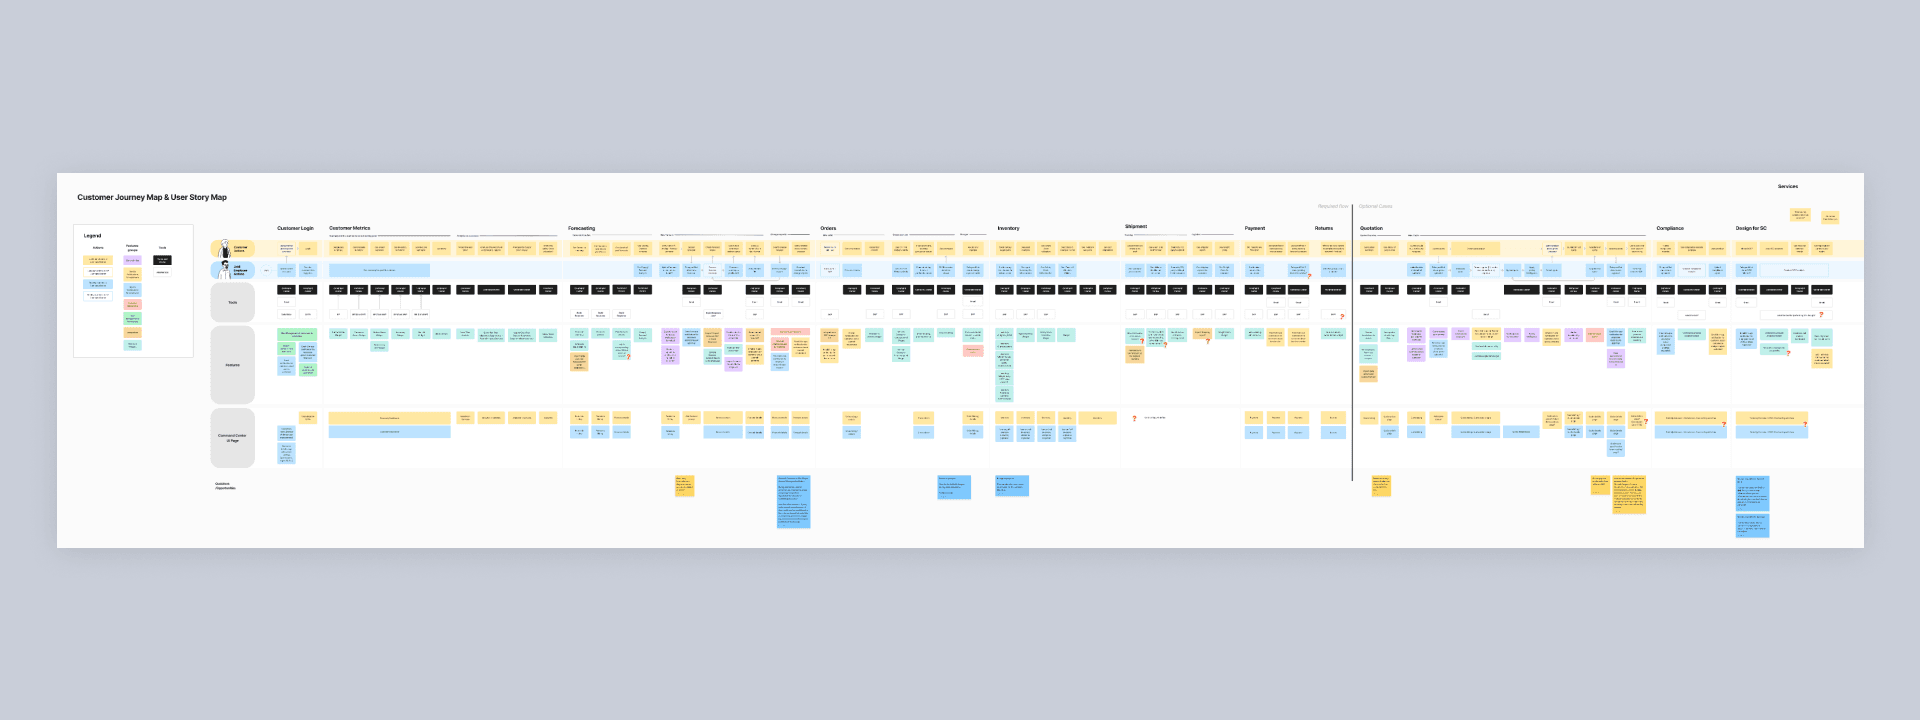
Service Blueprinting
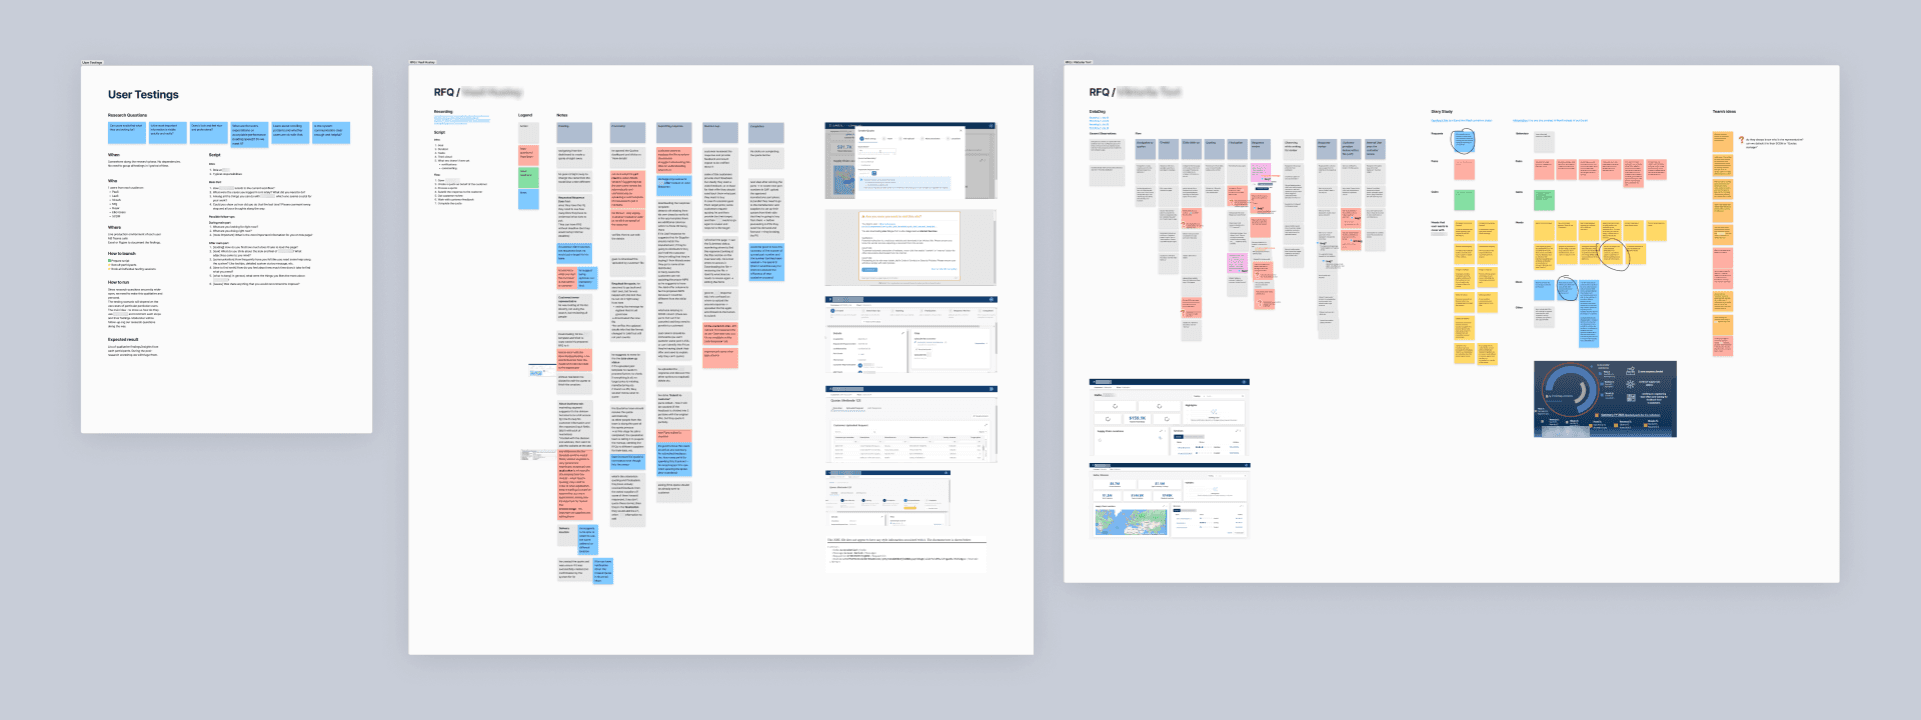
As we collected tons of data through research and workshops, we looked for a way to map the customer journey with internal actions and product features.
02
Service Blueprinting
As we collected tons of data through research and workshops, we looked for a way to map the customer journey with internal actions and product features.
02
Service Blueprinting
As we collected tons of data through research and workshops, we looked for a way to map the customer journey with internal actions and product features.
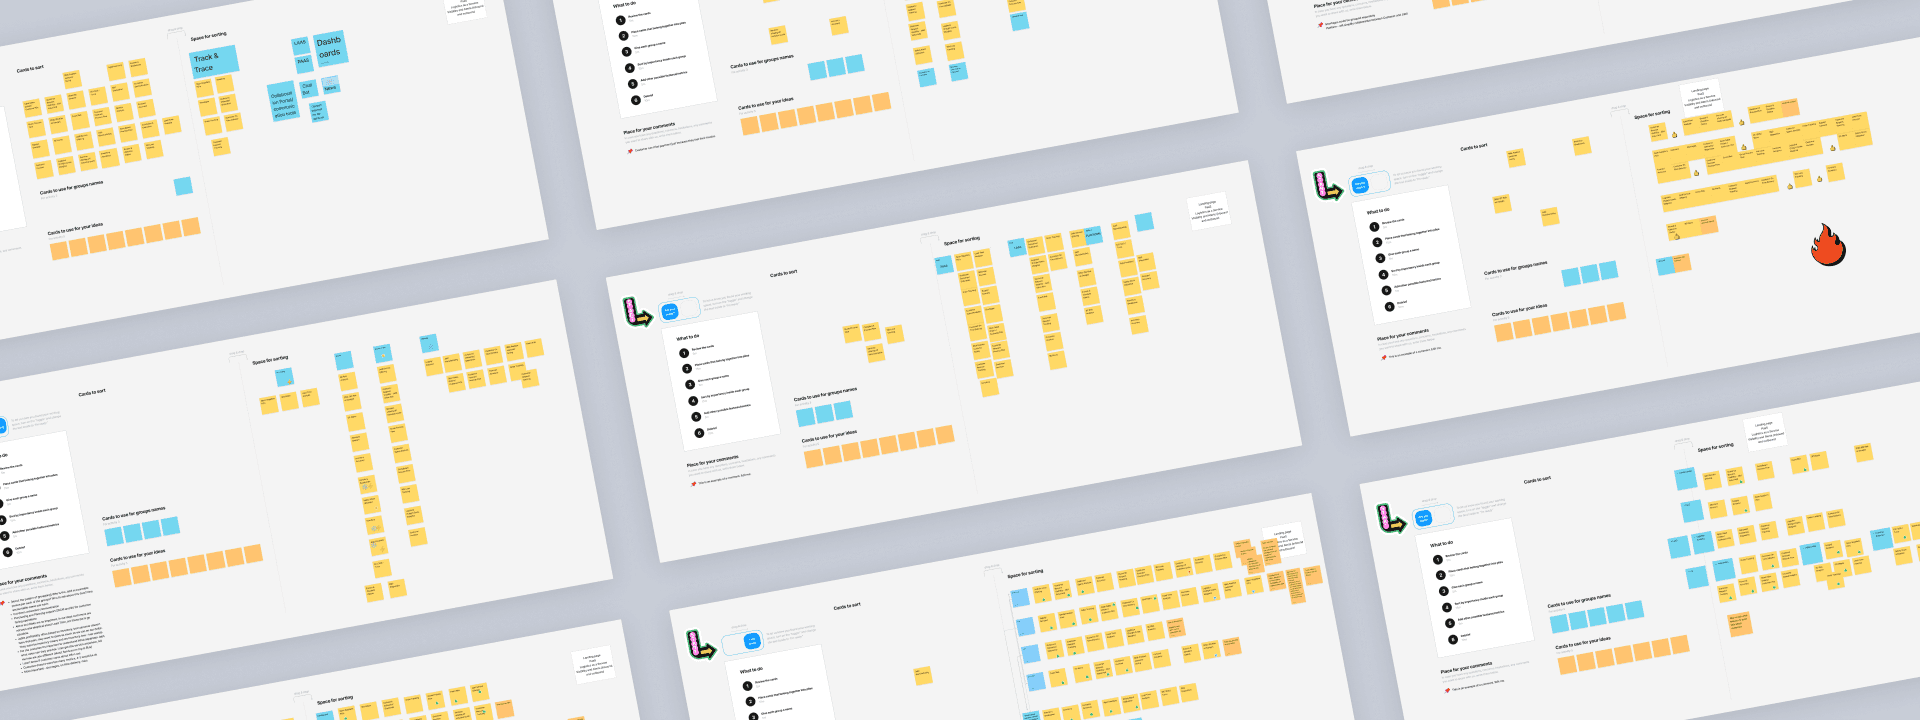
03
Card Sorting
As we had many roles, services, and business ideas, card sorting helped us to identify how to organise this into a simple navigation structure.
03
Card Sorting
As we had many roles, services, and business ideas, card sorting helped us to identify how to organise this into a simple navigation structure.
03
Card Sorting
As we had many roles, services, and business ideas, card sorting helped us to identify how to organise this into a simple navigation structure.
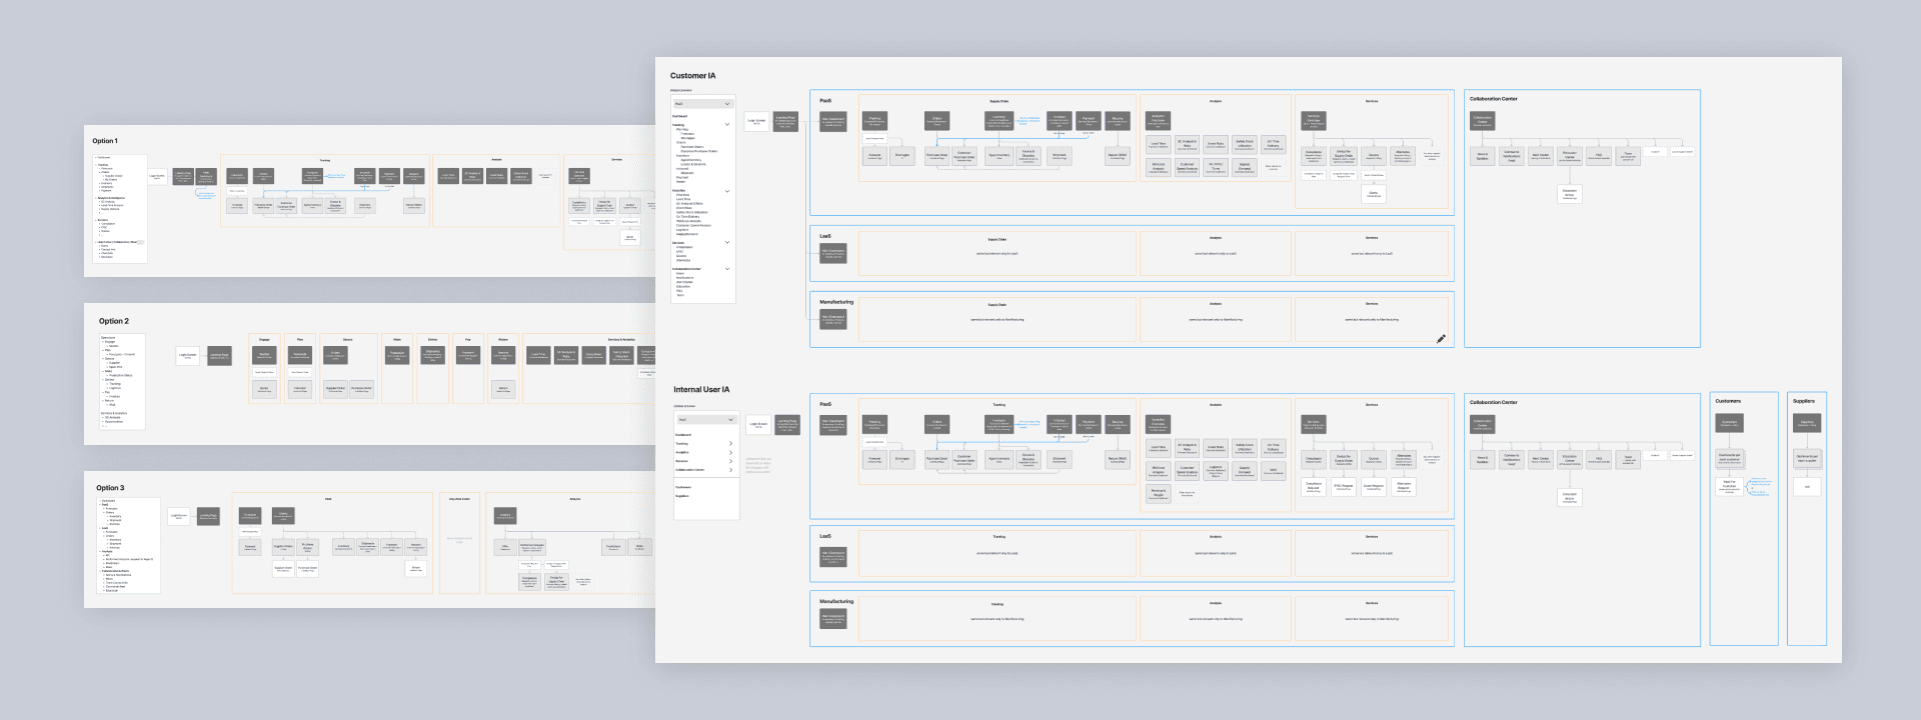
04
Information Architecture
Card sorting results later evolved into several information architecture options. The architects chose the simplest to align front-end and back-end logic.
04
Information Architecture
Card sorting results later evolved into several information architecture options. The architects chose the simplest to align front-end and back-end logic.
04
Information Architecture
Card sorting results later evolved into several information architecture options. The architects chose the simplest to align front-end and back-end logic.
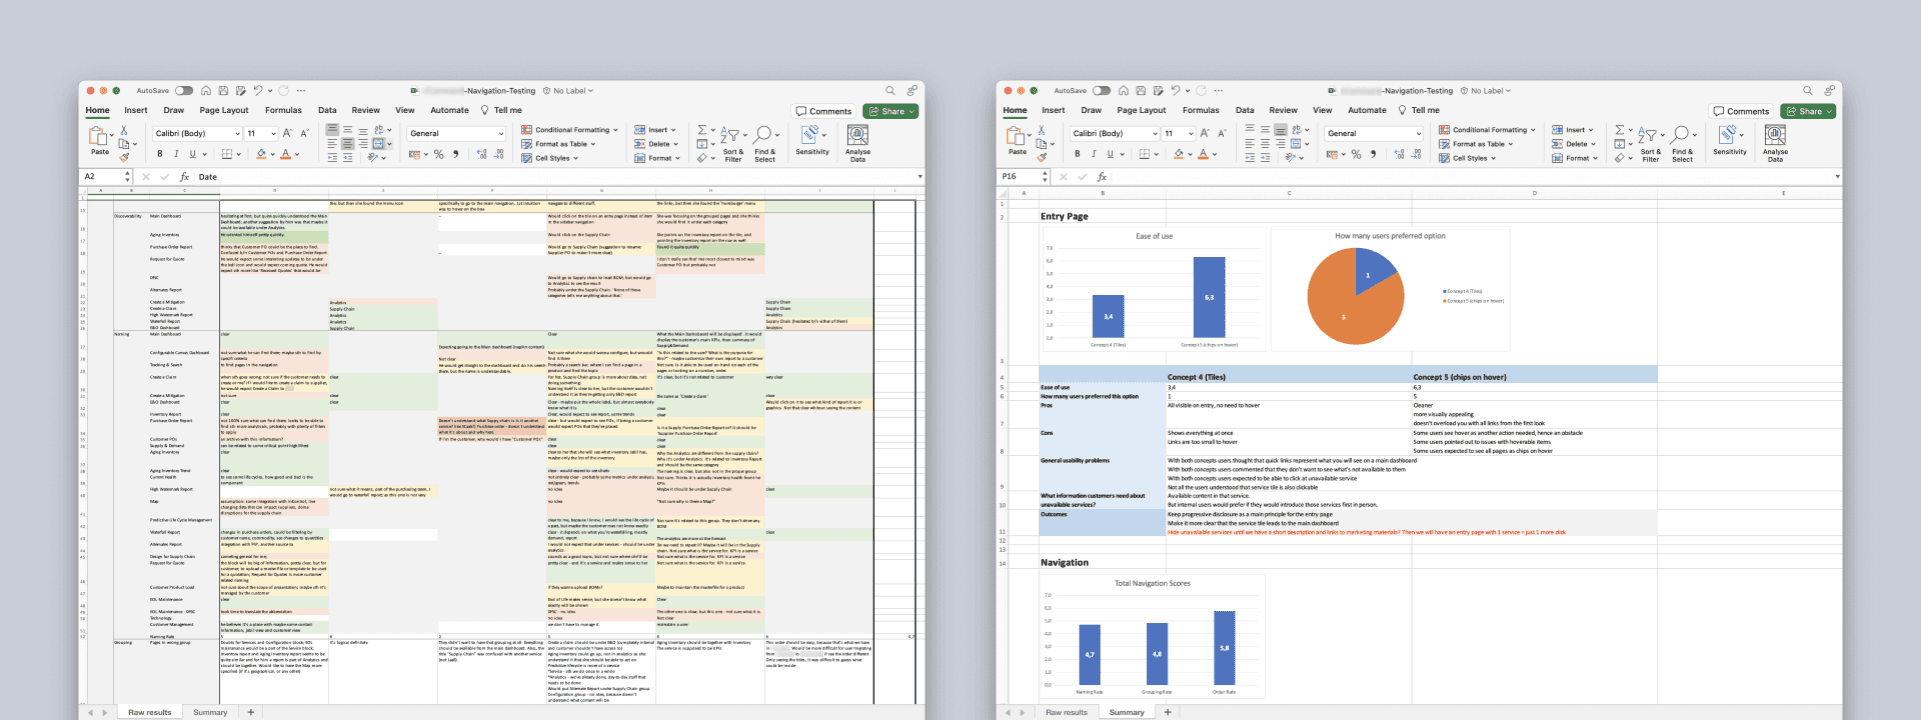
05
Navigation Testing
Although the navigation was based on user mental models, we also tested its grouping, order, and naming. This helped us to fix a few issues early.
05
Navigation Testing
Although the navigation was based on user mental models, we also tested its grouping, order, and naming. This helped us to fix a few issues early.
05
Navigation Testing
Although the navigation was based on user mental models, we also tested its grouping, order, and naming. This helped us to fix a few issues early.
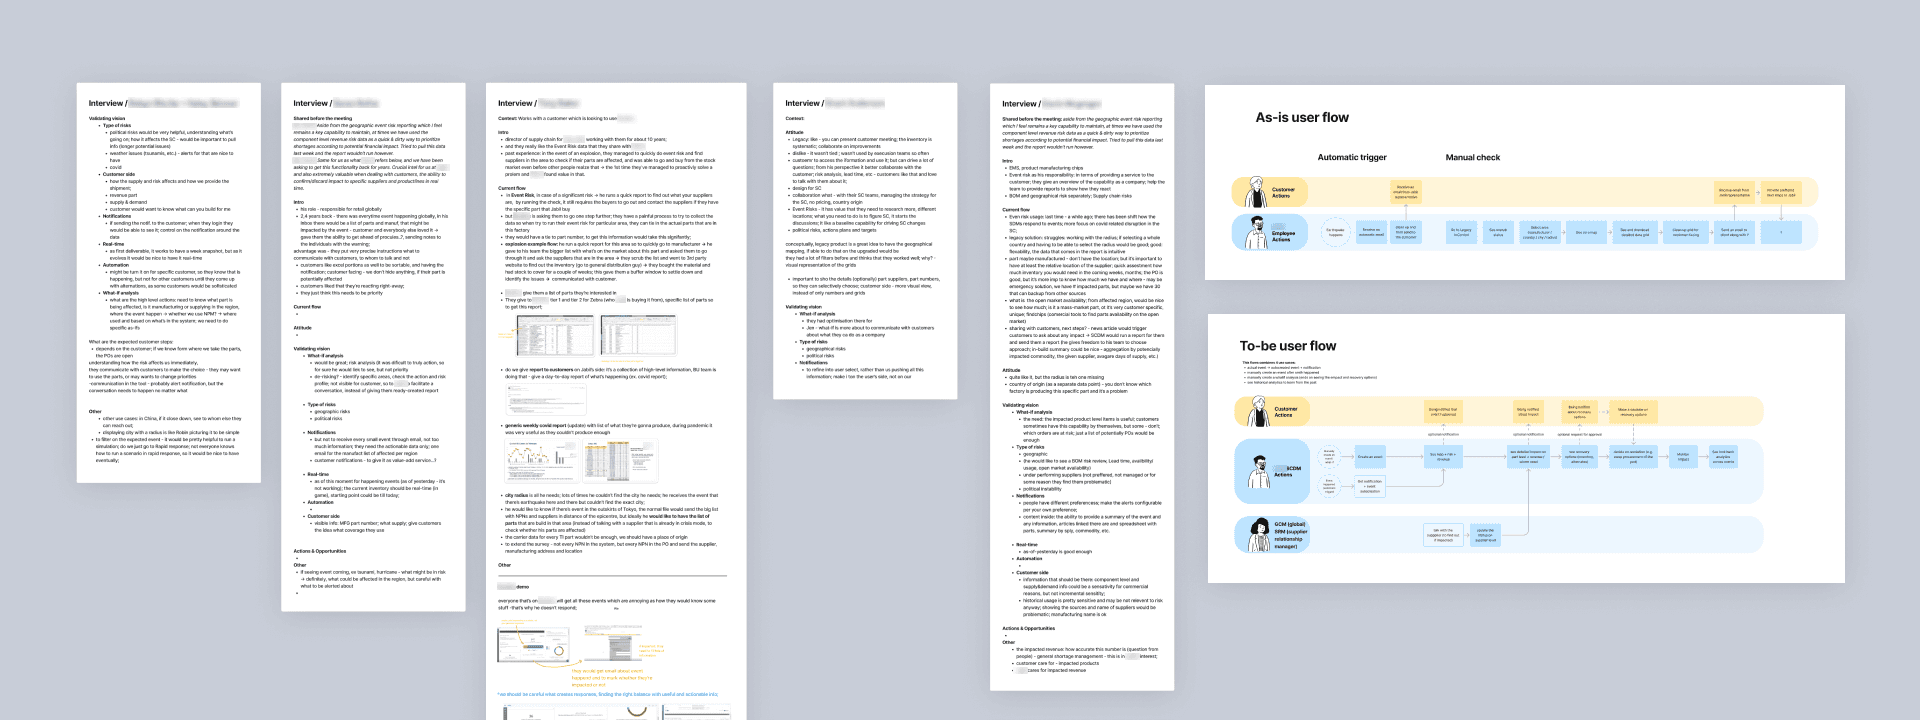
06
User Interviews
We spoke with key users to understand current flows, pain points, and needs, then mapped as-is and to-be flows to guide low-fidelity prototyping.
06
User Interviews
We spoke with key users to understand current flows, pain points, and needs, then mapped as-is and to-be flows to guide low-fidelity prototyping.
06
User Interviews
We spoke with key users to understand current flows, pain points, and needs, then mapped as-is and to-be flows to guide low-fidelity prototyping.
07
User Testing
Each design phase had a testing loop. We tested low-fidelity prototypes to choose the UI model. Then, we tested animated high-fidelity prototypes to find usability issues and measure UX metrics. Finally, we tested the real environment to see how it feels with real data.
07
User Testing
Each design phase had a testing loop. We tested low-fidelity prototypes to choose the UI model. Then, we tested animated high-fidelity prototypes to find usability issues and measure UX metrics. Finally, we tested the real environment to see how it feels with real data.
07
User Testing
Each design phase had a testing loop. We tested low-fidelity prototypes to choose the UI model. Then, we tested animated high-fidelity prototypes to find usability issues and measure UX metrics. Finally, we tested the real environment to see how it feels with real data.
08
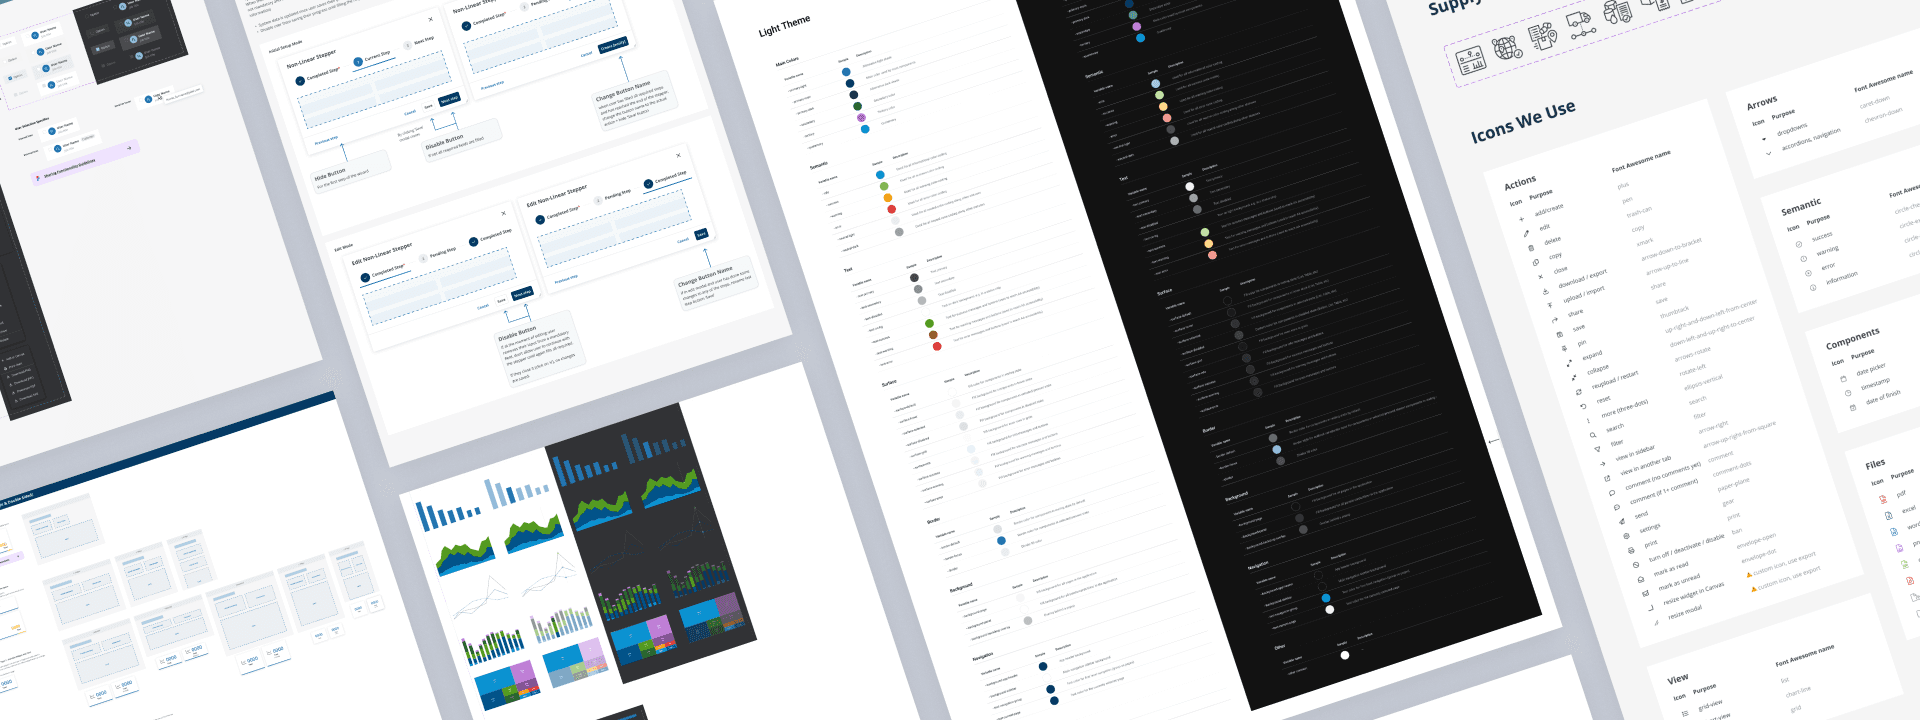
Design System
We used the basic components from the customer's original DS and added custom ones to fit product needs. A key improvement was a new system for naming color variables that reduced the light/dark theme switch time from 7 seconds to instant.
08
Design System
We used the basic components from the customer's original DS and added custom ones to fit product needs. A key improvement was a new system for naming color variables that reduced the light/dark theme switch time from 7 seconds to instant.
08
Design System
We used the basic components from the customer's original DS and added custom ones to fit product needs. A key improvement was a new system for naming color variables that reduced the light/dark theme switch time from 7 seconds to instant.
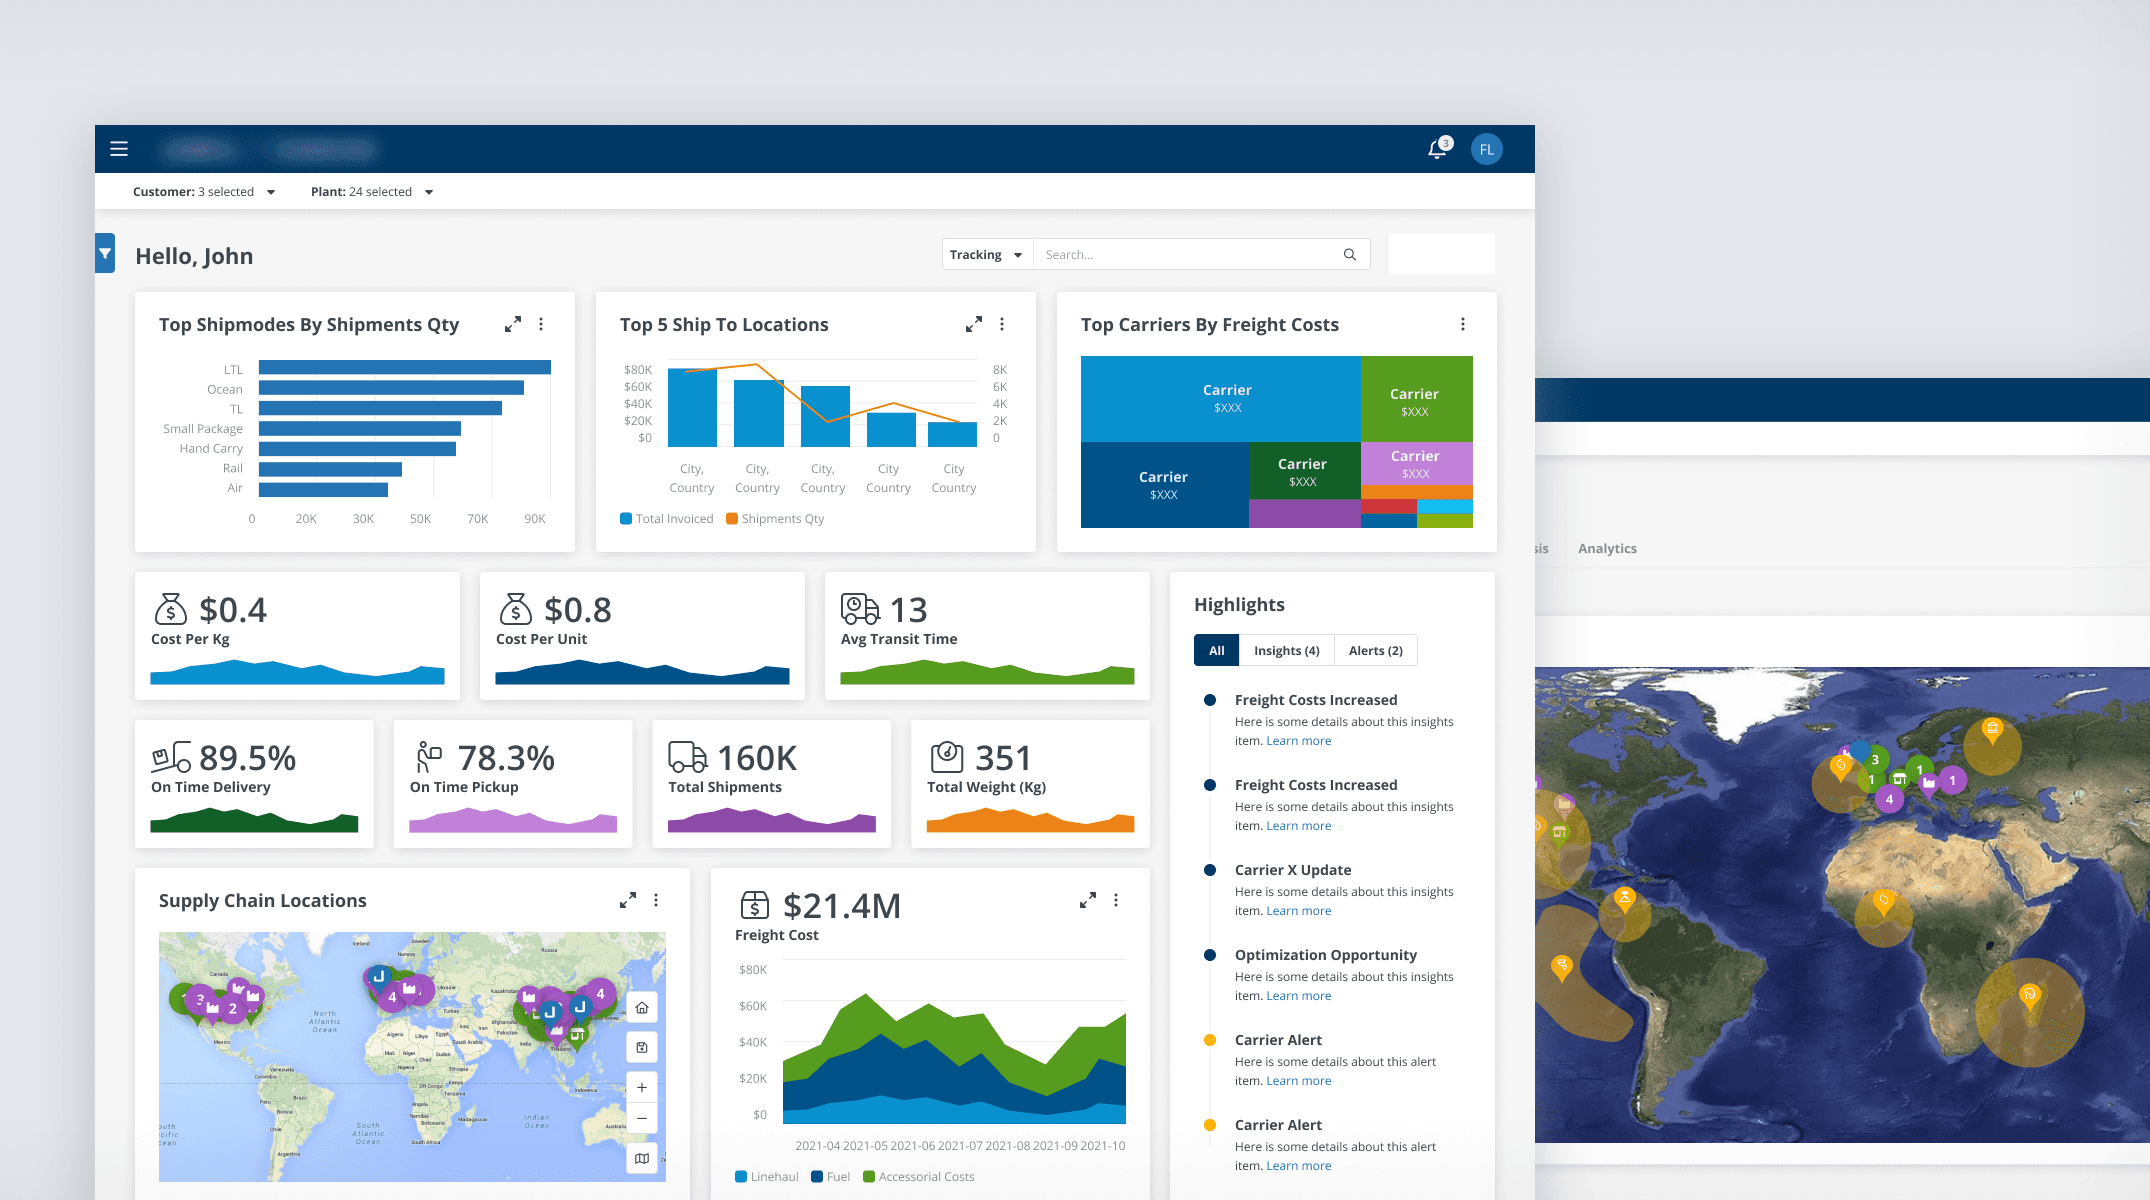
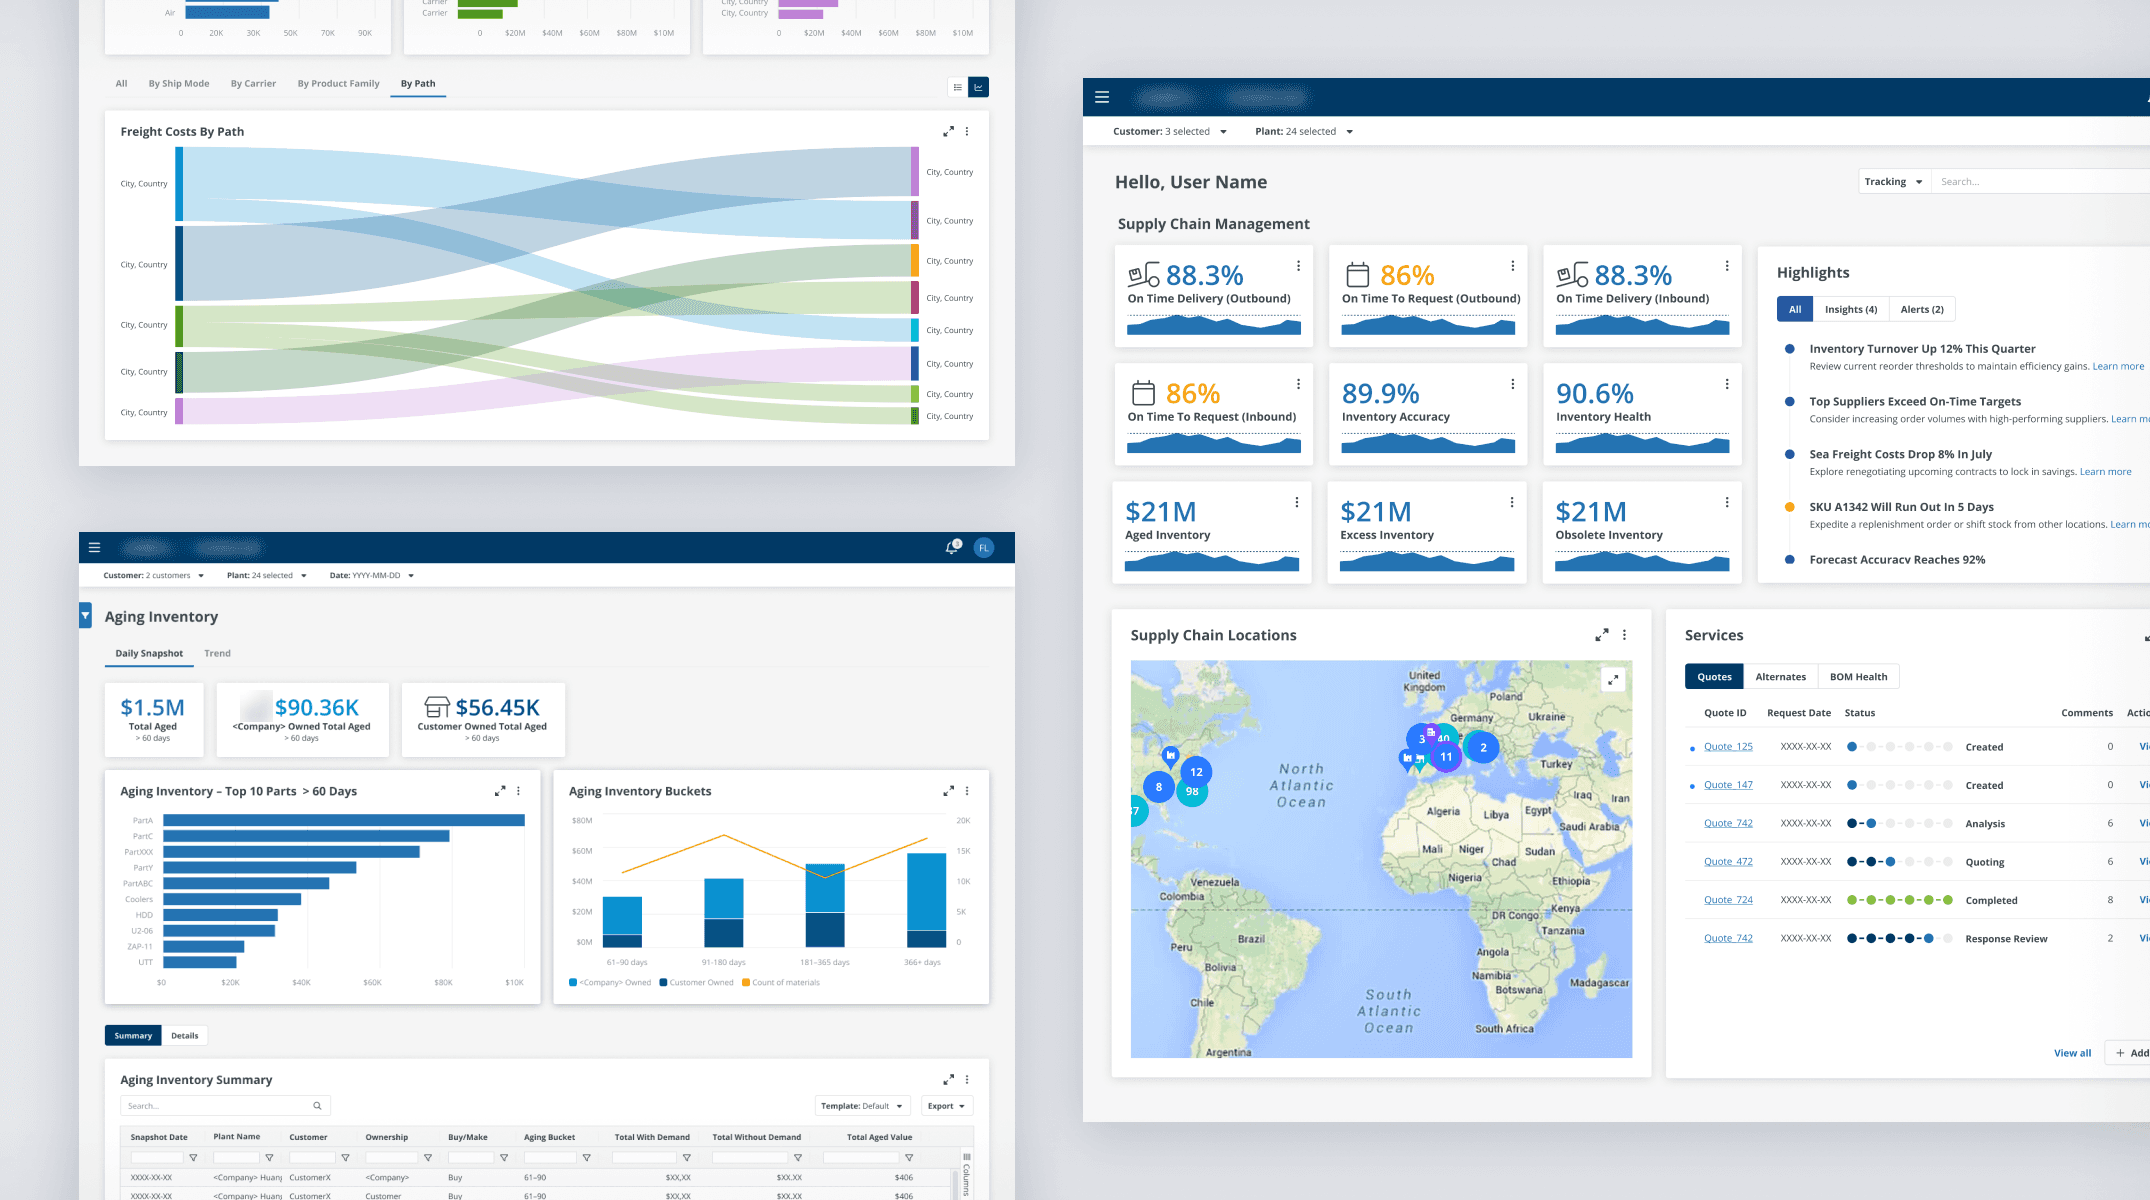
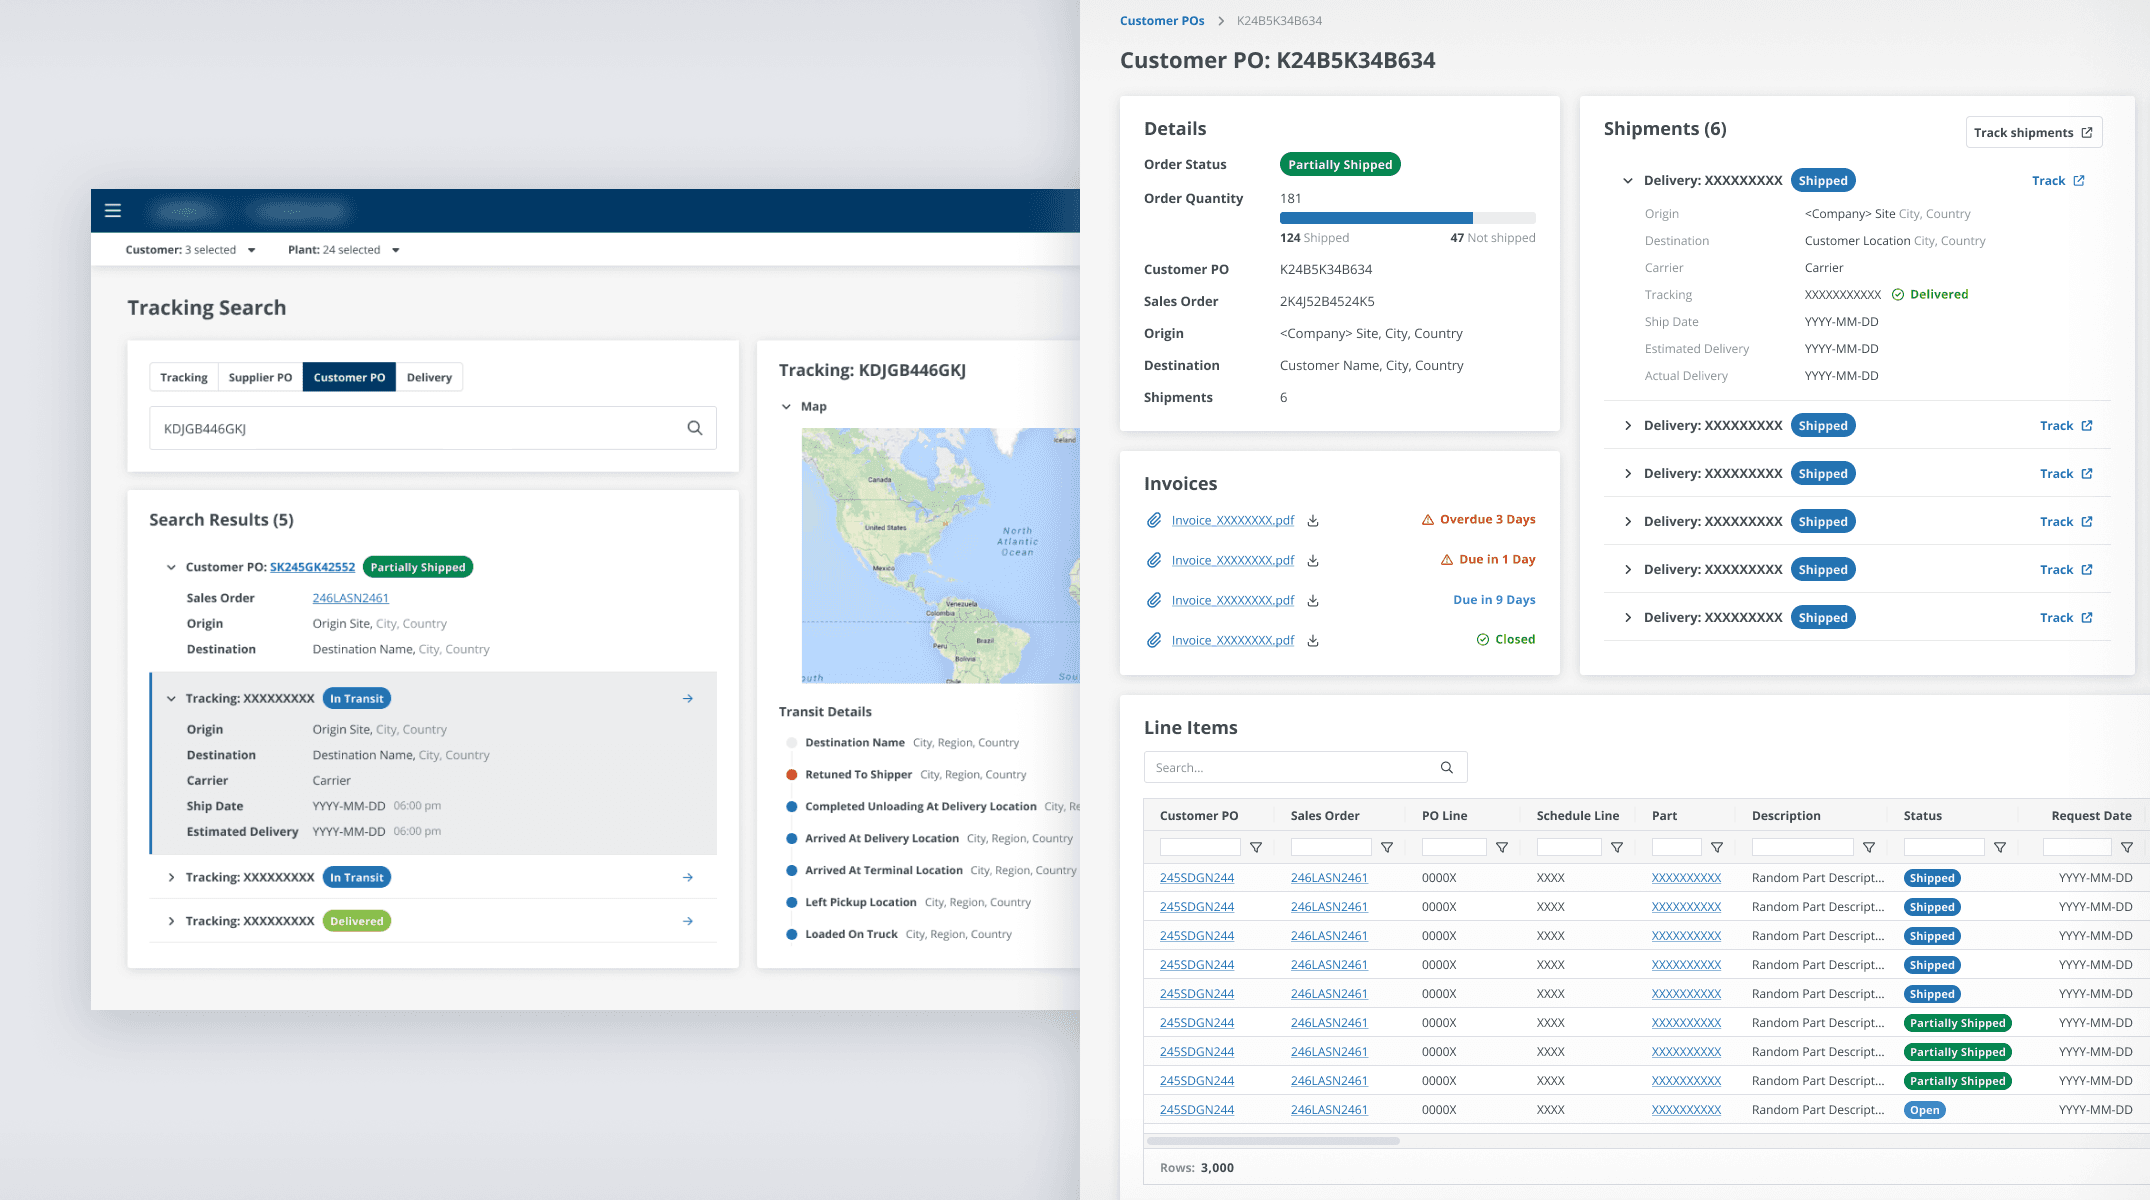
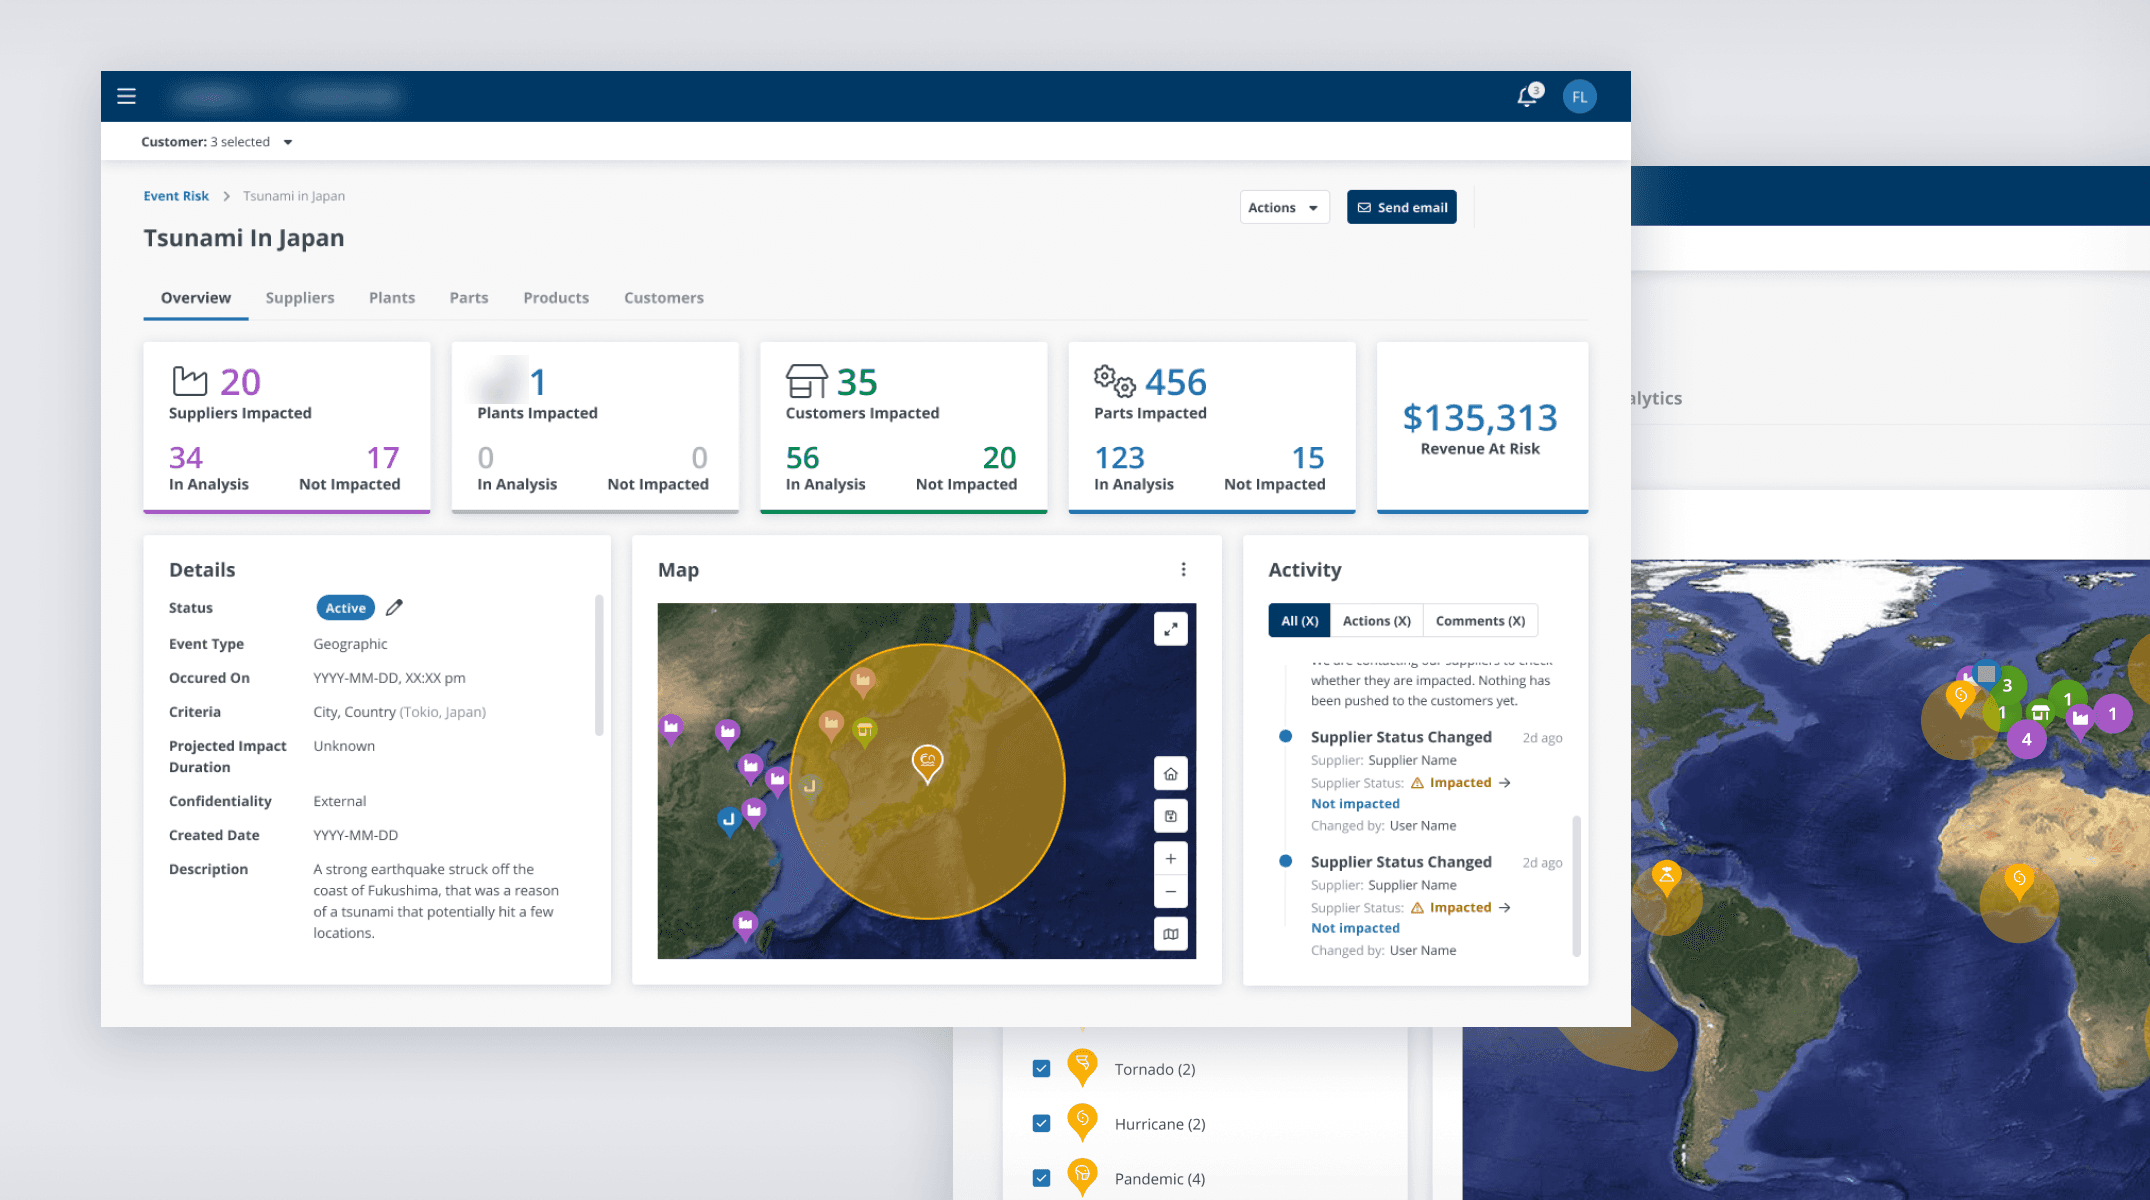
09
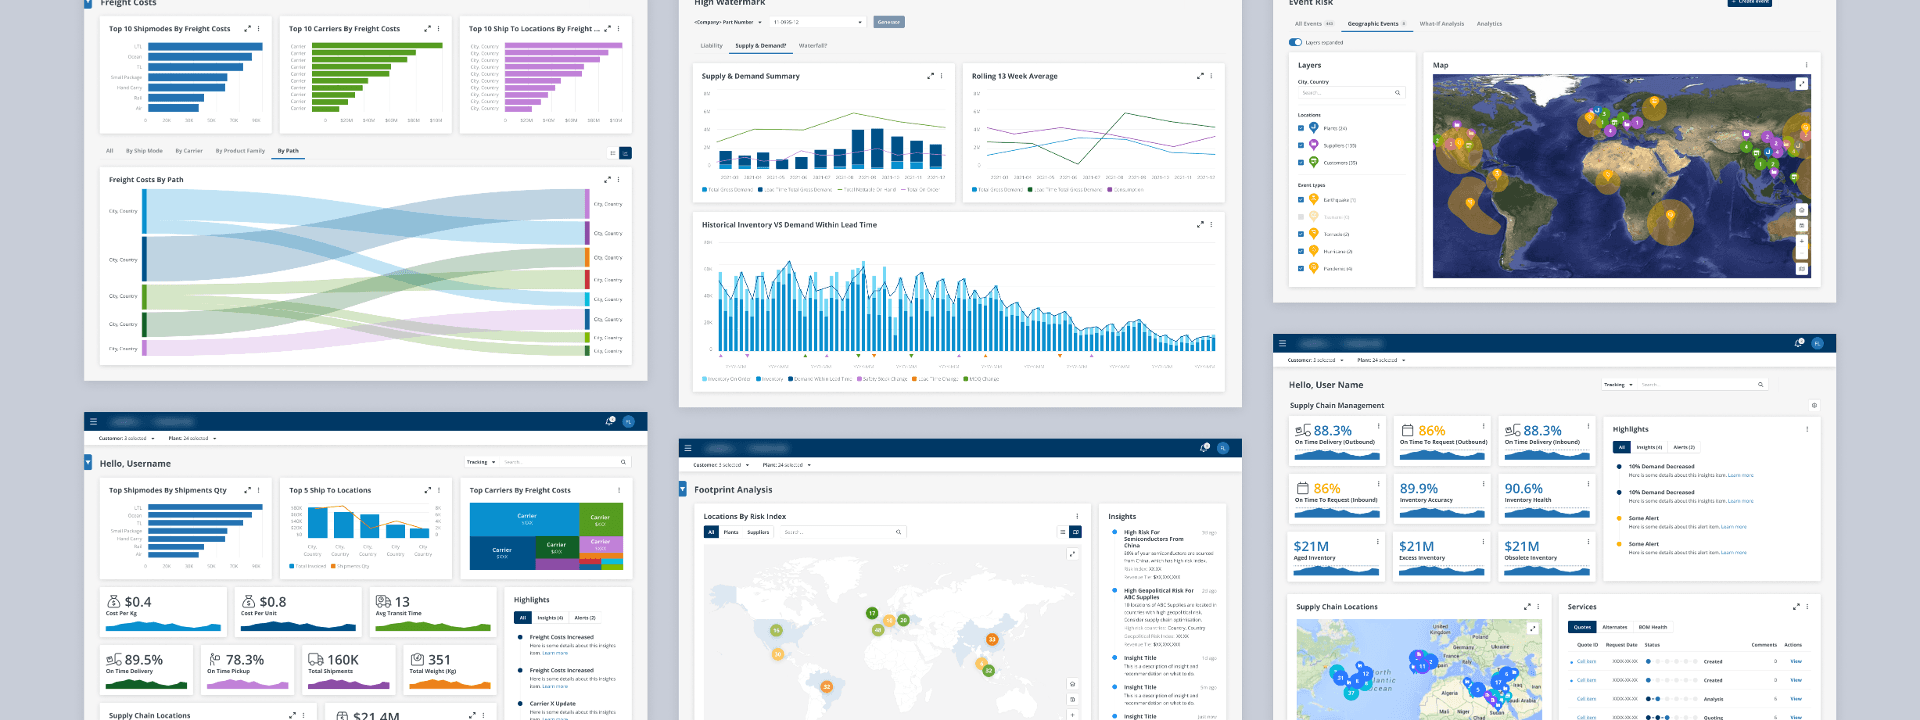
Data Visualization
We used many chart types and custom KPI widgets to handle large data sets. A big part of the work focused on maps—showing locations, clusters, events, shipment routes, and supply chain risk analysis.
09
Data Visualization
We used many chart types and custom KPI widgets to handle large data sets. A big part of the work focused on maps—showing locations, clusters, events, shipment routes, and supply chain risk analysis.
09
Data Visualization
We used many chart types and custom KPI widgets to handle large data sets. A big part of the work focused on maps—showing locations, clusters, events, shipment routes, and supply chain risk analysis.
10
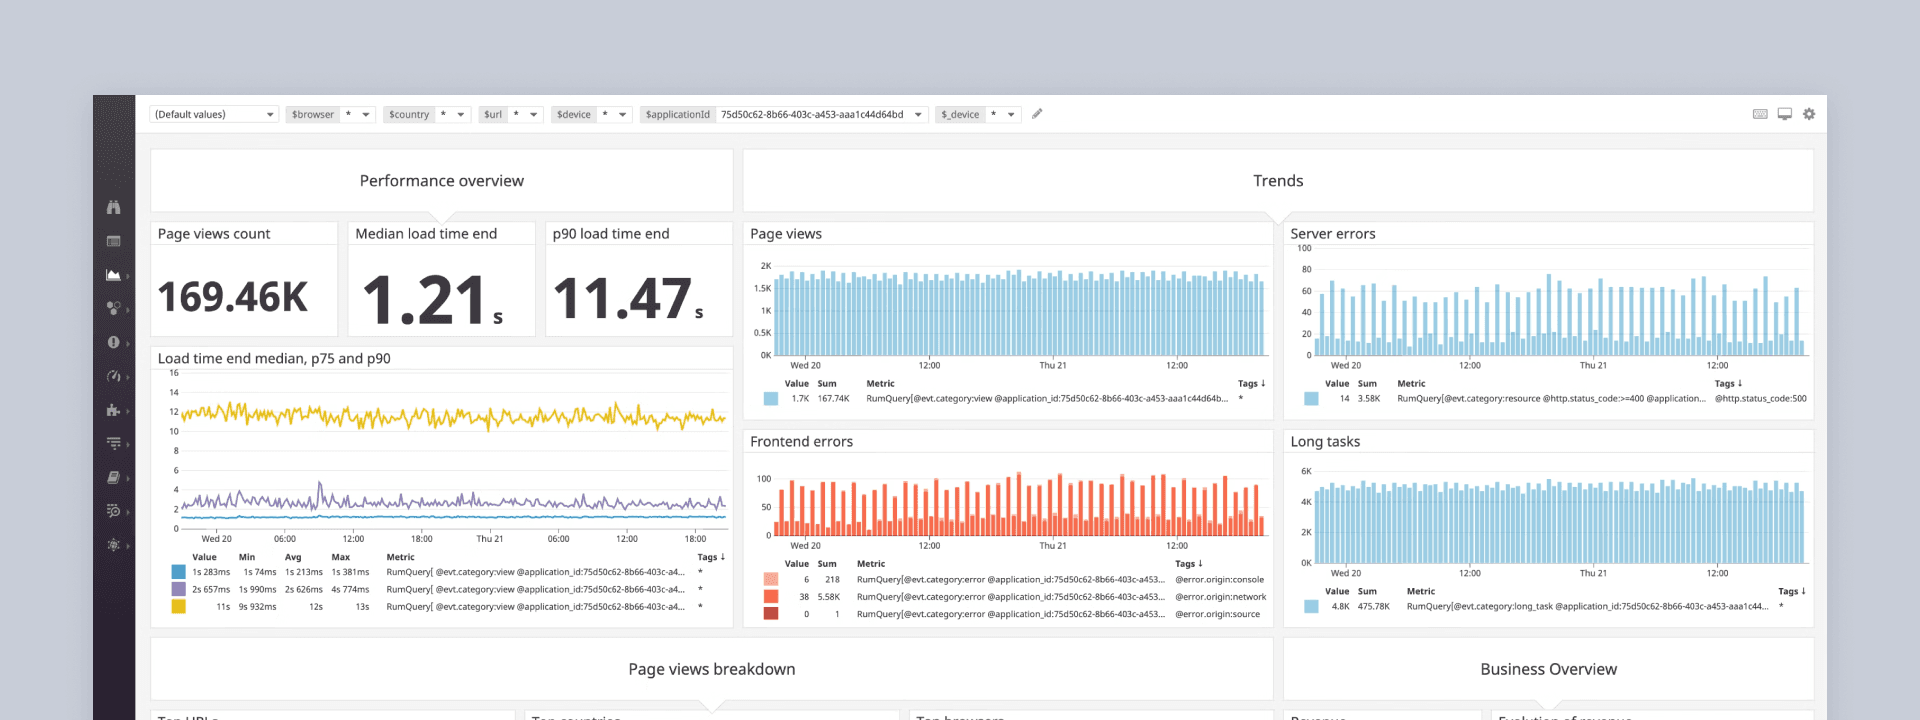
UX Analytics
The company has been using Data Dog analytics as a standard analytics tool, so we reused the data and user session recordings to learn how long typical tasks take, and what struggles and mistakes users face.
10
UX Analytics
The company has been using Data Dog analytics as a standard analytics tool, so we reused the data and user session recordings to learn how long typical tasks take, and what struggles and mistakes users face.
10
UX Analytics
The company has been using Data Dog analytics as a standard analytics tool, so we reused the data and user session recordings to learn how long typical tasks take, and what struggles and mistakes users face.
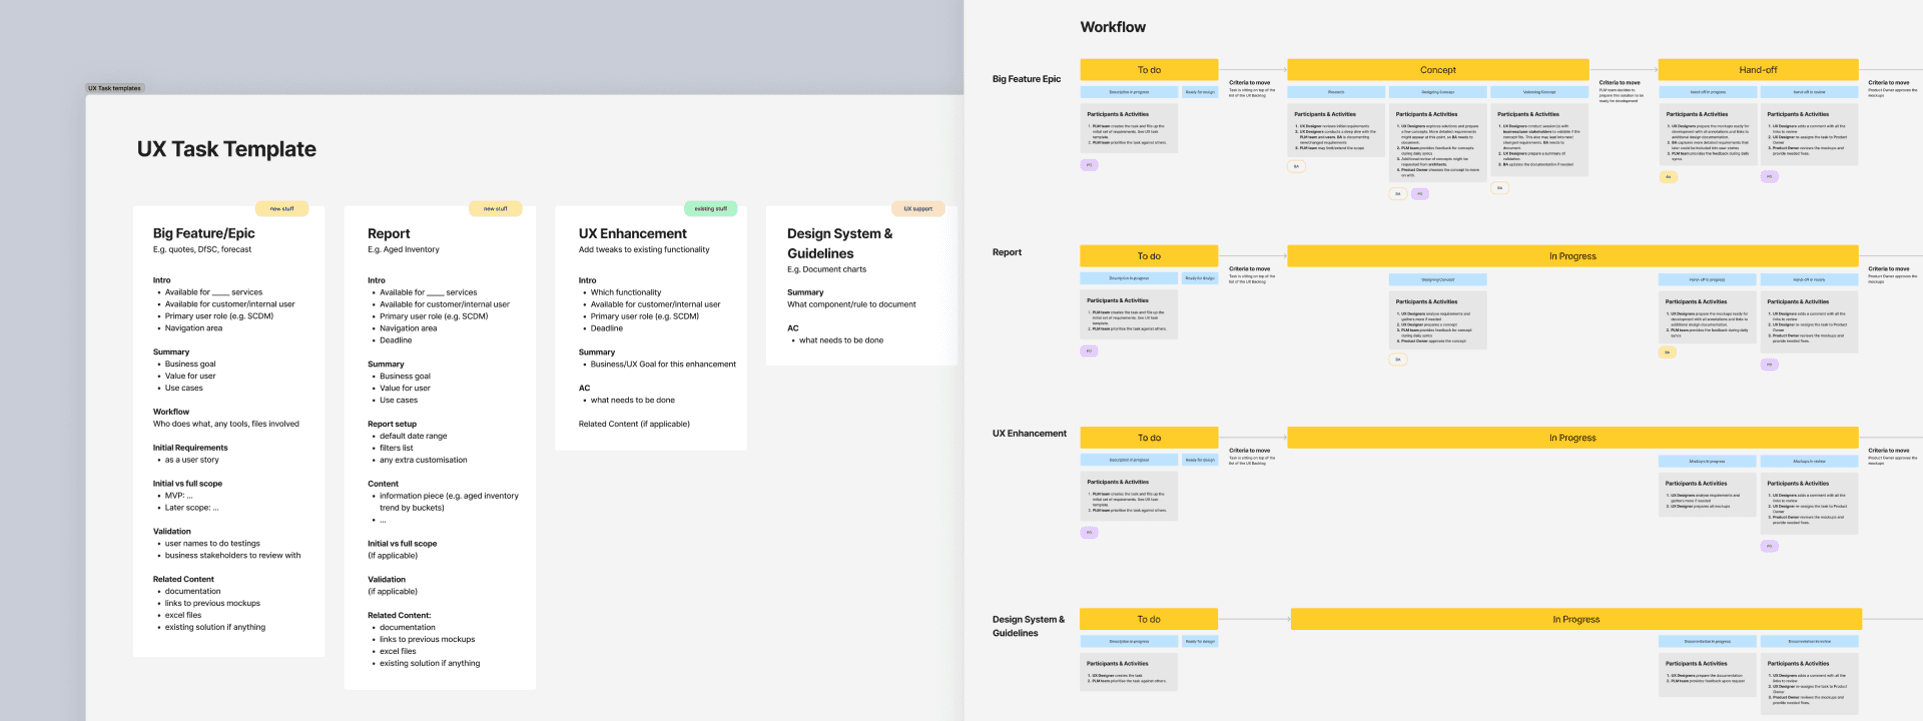
11
DesignOps
We standardized the collaboration workflow for UX, BA, Product Owners, and Architects to match the design cycle. POs started giving more structured requirements and approvals, while the team always had clear visibility on progress.
11
DesignOps
We standardized the collaboration workflow for UX, BA, Product Owners, and Architects to match the design cycle. POs started giving more structured requirements and approvals, while the team always had clear visibility on progress.
11
DesignOps
We standardized the collaboration workflow for UX, BA, Product Owners, and Architects to match the design cycle. POs started giving more structured requirements and approvals, while the team always had clear visibility on progress.
Outcomes
Outcomes
Outcomes
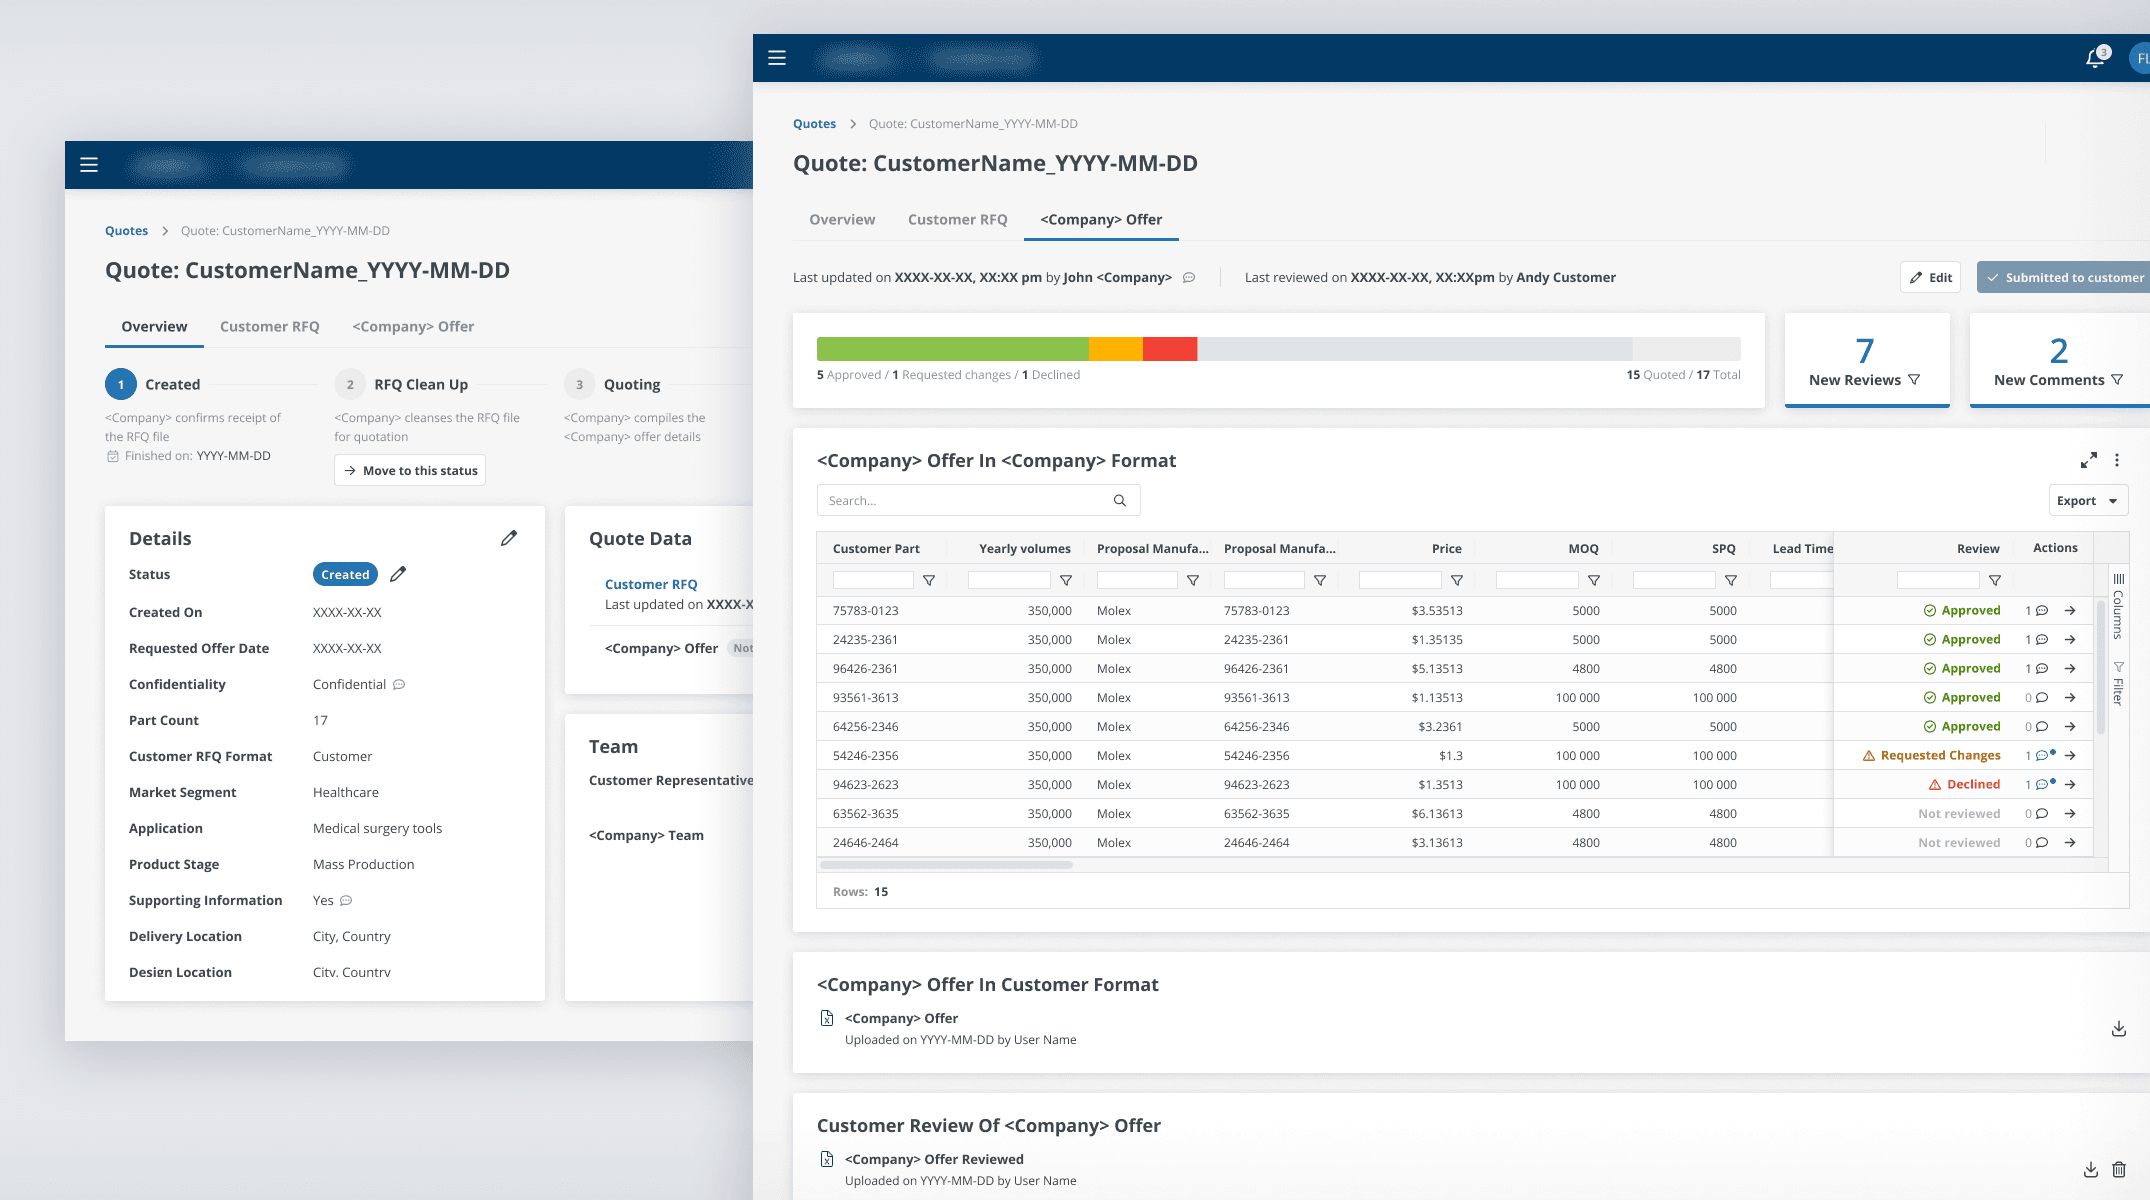
End-to-end supply chain visibility through digital twin;
Secured collaboration through structured file sharing and review process;
Improved business resiliency, including geopolitical risk management and a smoothed unified escalation process;
Non-value-added activities are removed from the process;
Processes are more standardised between hundreds of local divisions and 250,000 employees;
Reduced labour and material costs;
Huge customer interest, which makes this solution a key differentiator in the supply chain market.