User Research For Advertisement Management Portal
CLIENT
AdTech Company
CLIENT
AdTech Company
Team Composition
Lead UX Designer (me) Middle UX Designer
Team Composition
Lead UX Designer (me) Middle UX Designer
Time of Involvement
3 months
Time of Involvement
3 months
Led an intensive 12-week discovery process, conducting dozens of user interviews and workshops to support product owners with scoping, roadmap planning, and prioritization.
Challenge
Challenge
Challenge
How might we make the creative management process so effortless that advertisers and publishers can exchange assets easily, approve them quickly, and no one gets stuck playing middleman?
Solution
Solution
Solution
A portal that automates asset sharing and specification checks, while streamlining ad publishing and KPI reporting.
Approach
Approach
Approach
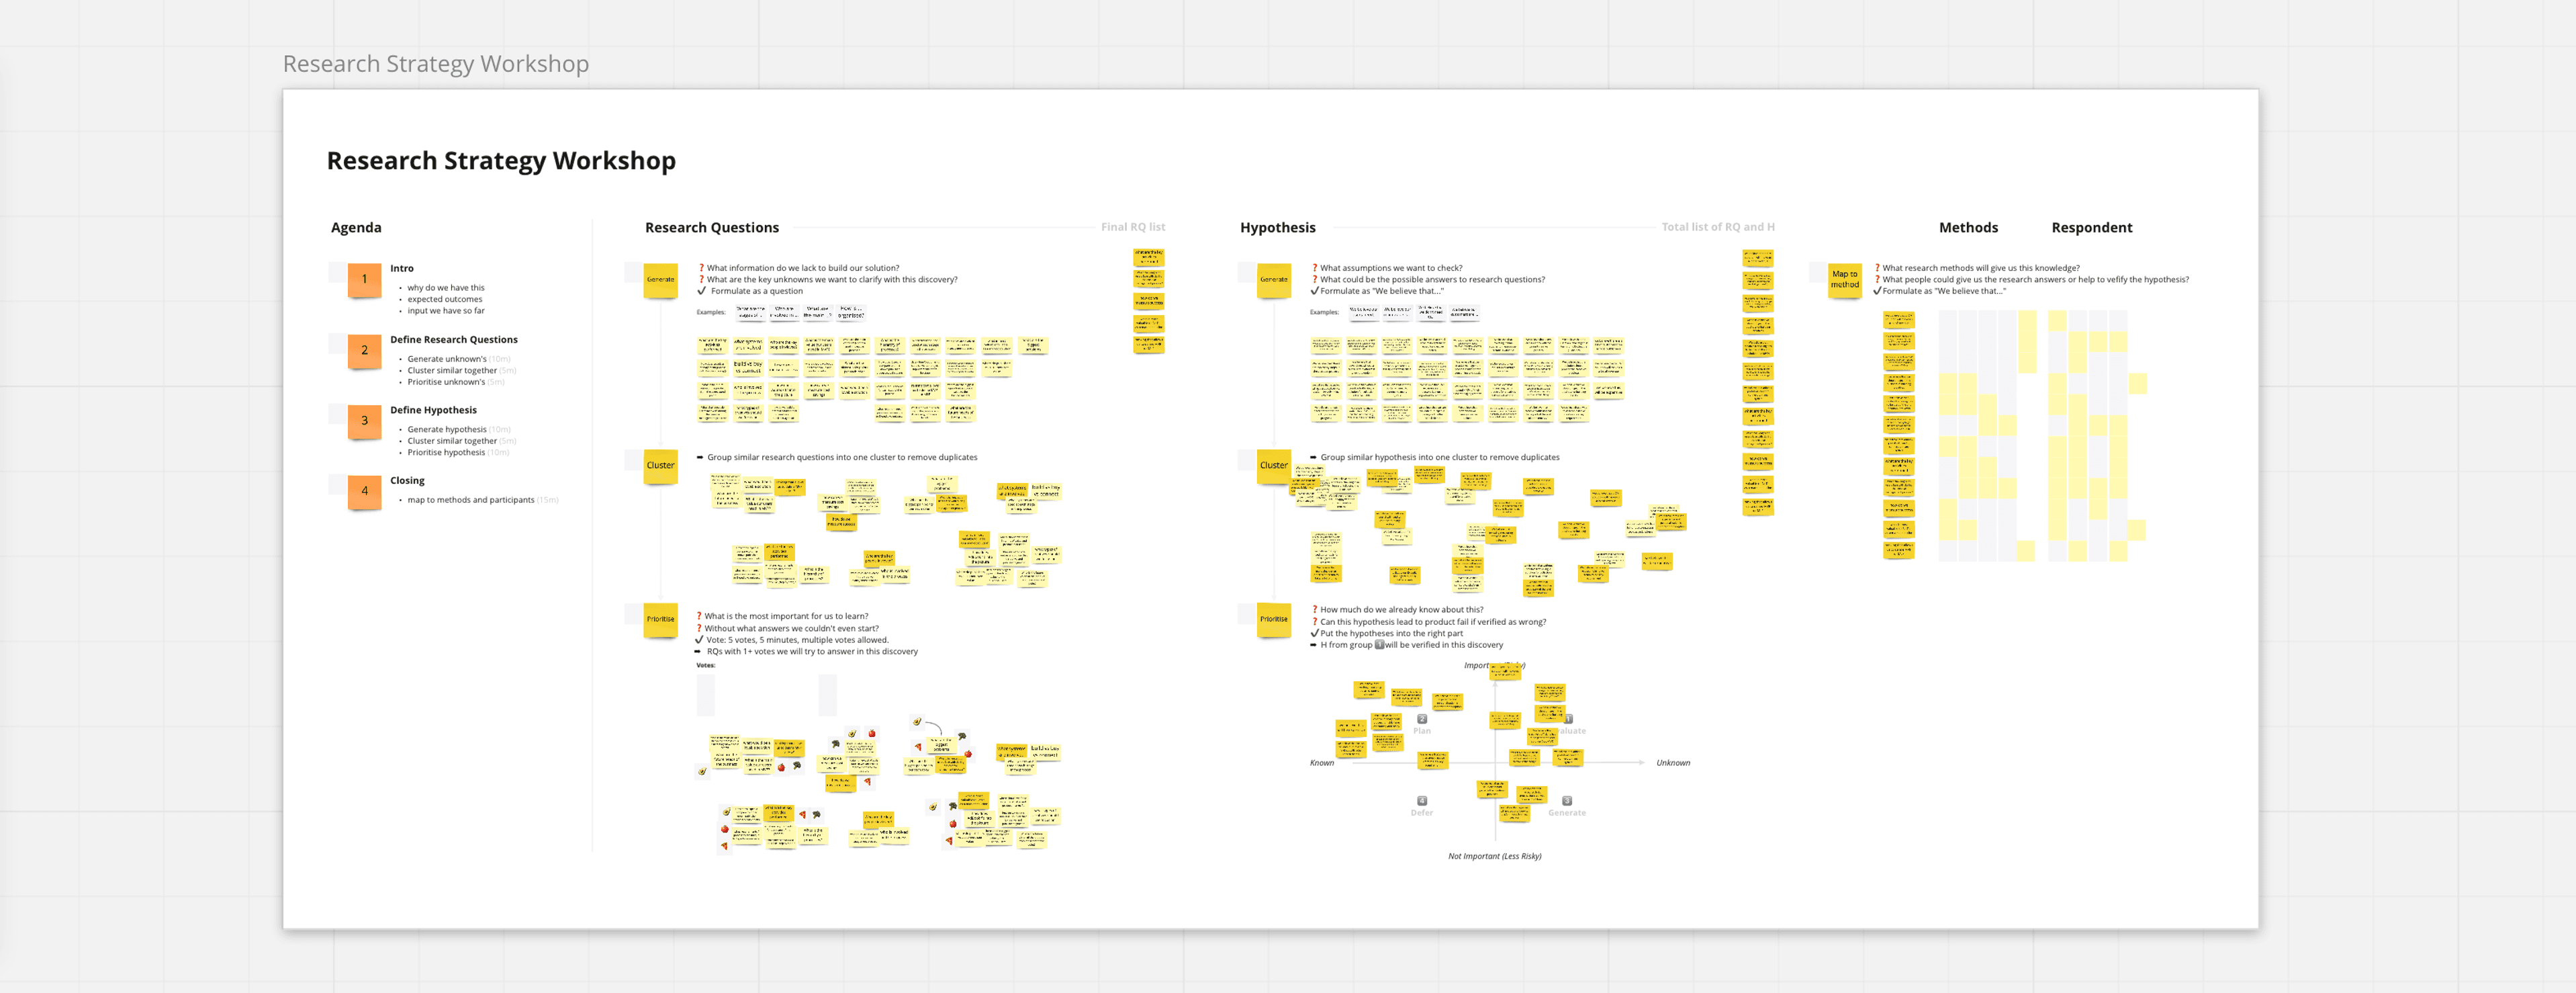
01
Research Strategy Workshop
We defined the key questions and hypotheses to explore. We also chose methods and identified the right people to get the answers from.
01
Research Strategy Workshop
We defined the key questions and hypotheses to explore. We also chose methods and identified the right people to get the answers from.
01
Research Strategy Workshop
We defined the key questions and hypotheses to explore. We also chose methods and identified the right people to get the answers from.
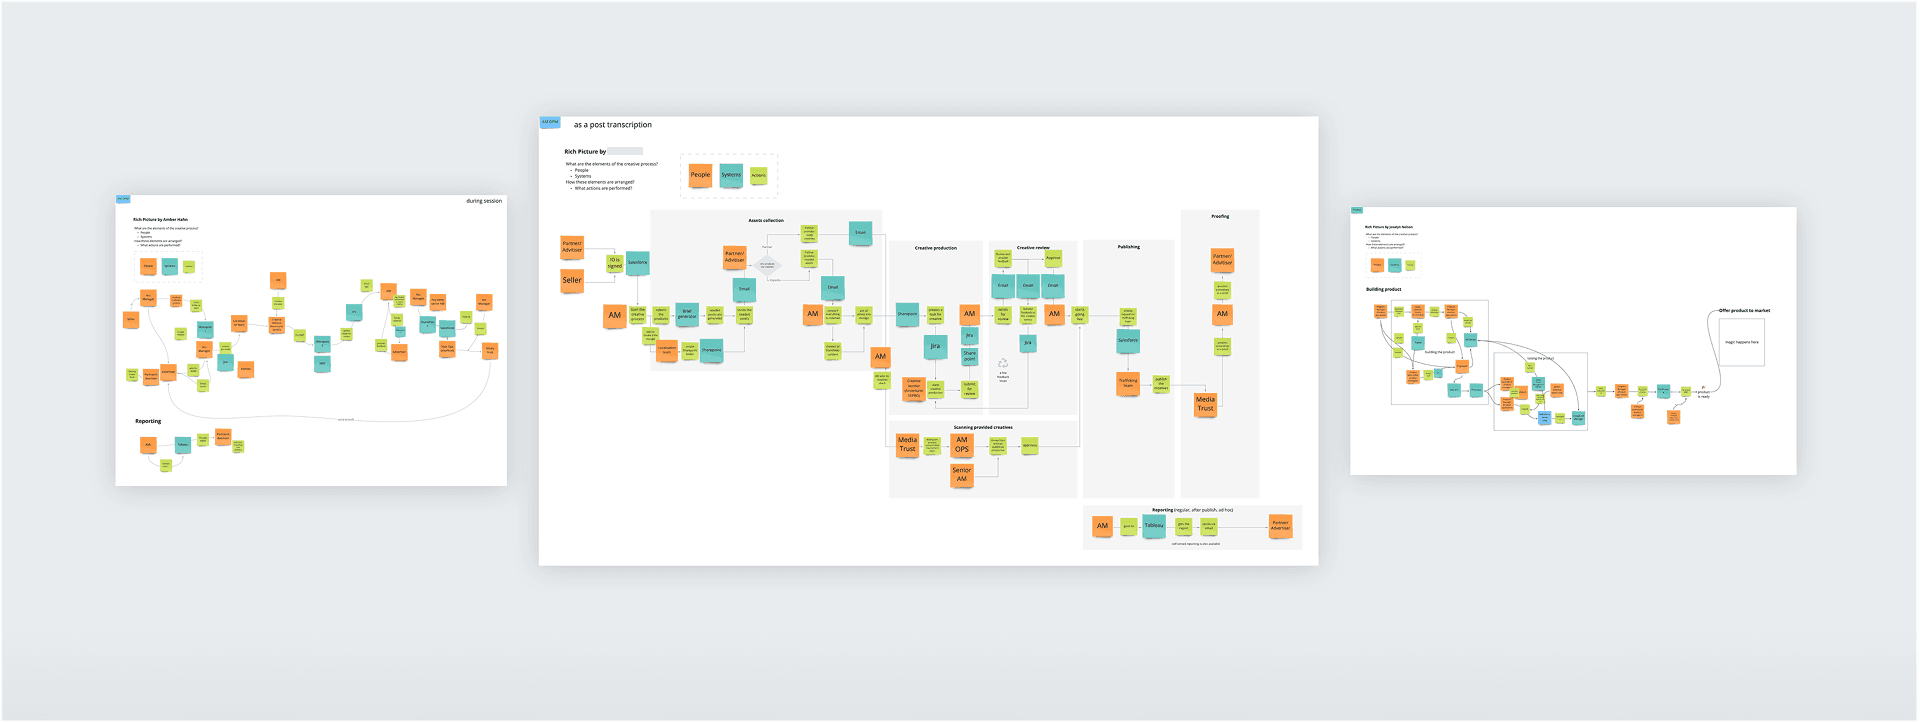
02
Rich Picture Mapping
Together with key stakeholders, we mapped out roles, tools, and process steps—along with all the elements influencing the user, organization, service, and data ecosystem.
02
Rich Picture Mapping
Together with key stakeholders, we mapped out roles, tools, and process steps—along with all the elements influencing the user, organization, service, and data ecosystem.
02
Rich Picture Mapping
Together with key stakeholders, we mapped out roles, tools, and process steps—along with all the elements influencing the user, organization, service, and data ecosystem.
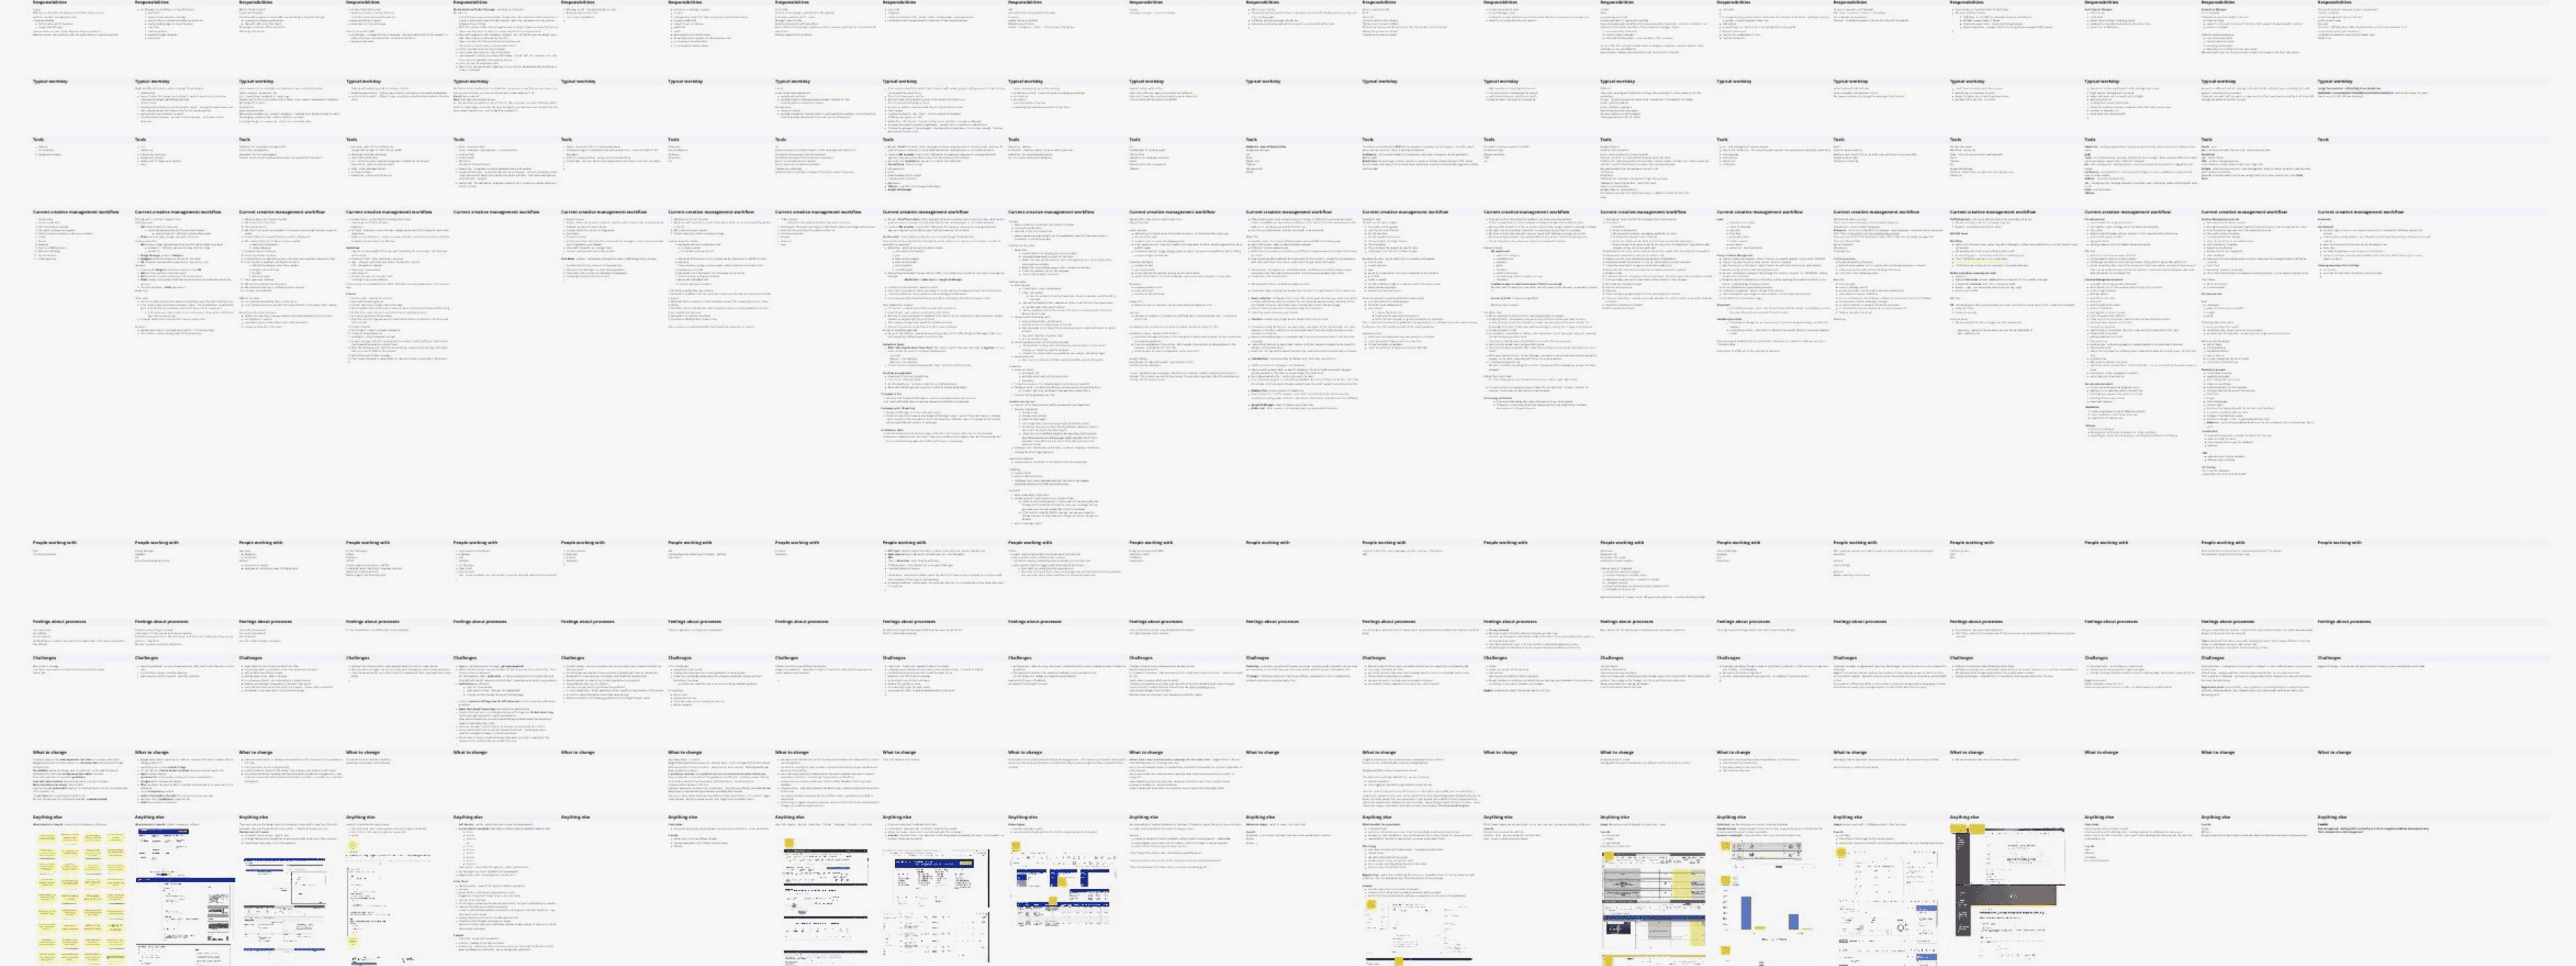
03
User Interviews
We interviewed 36 employees and 3 customers to understand their creative management workflows, pain points, and needs. This also gave us insight into the tools they use and how they interact with them.
03
User Interviews
We interviewed 36 employees and 3 customers to understand their creative management workflows, pain points, and needs. This also gave us insight into the tools they use and how they interact with them.
03
User Interviews
We interviewed 36 employees and 3 customers to understand their creative management workflows, pain points, and needs. This also gave us insight into the tools they use and how they interact with them.
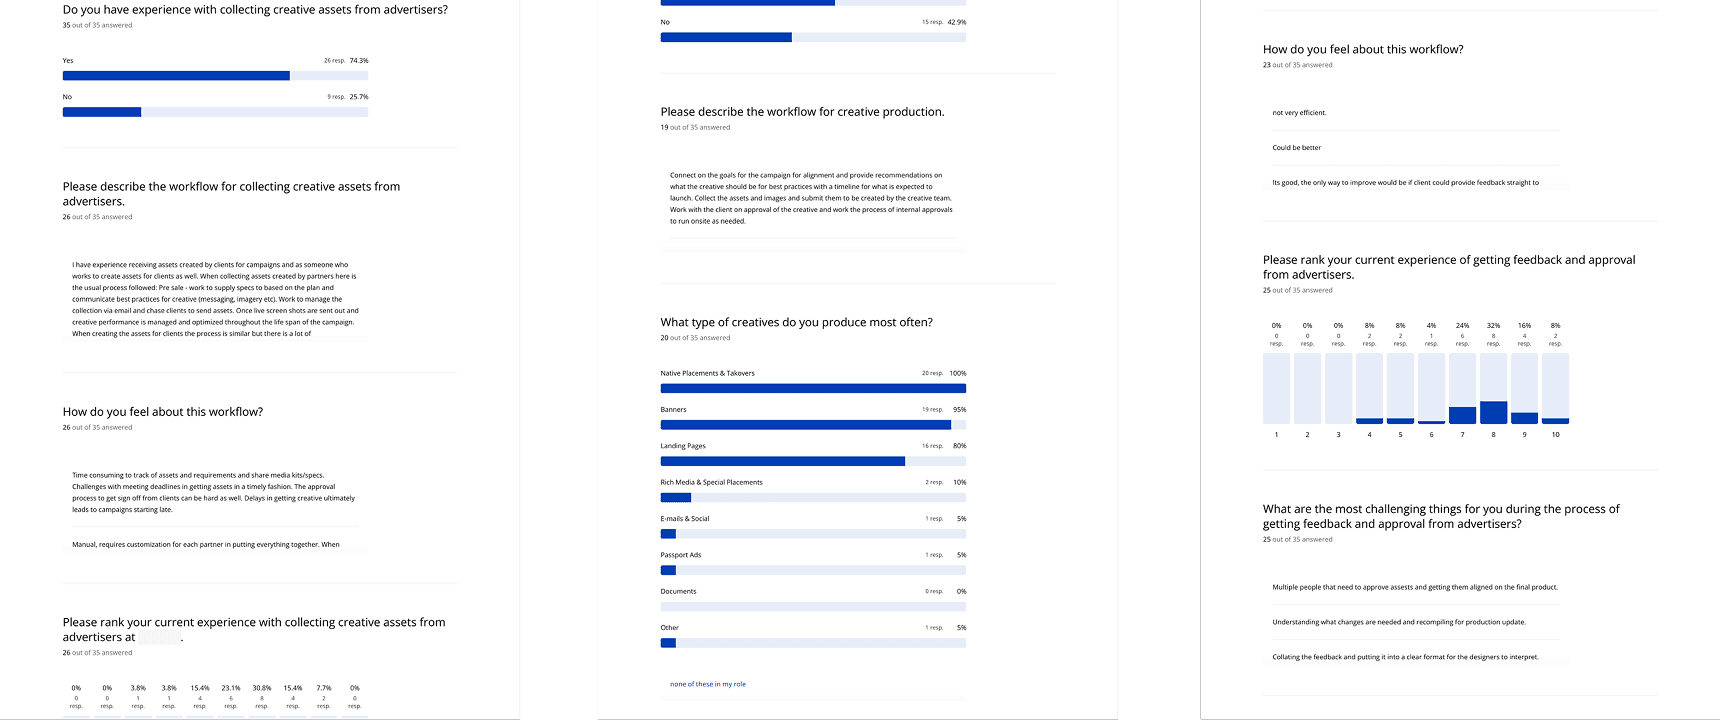
04
User Survey
In this case, the survey had mixed purposes: to gather qualitative insights and measure satisfaction at each step of the process. Sent to both employees and customers, it helped identify the biggest bottlenecks causing frustration on both sides.
04
User Survey
In this case, the survey had mixed purposes: to gather qualitative insights and measure satisfaction at each step of the process. Sent to both employees and customers, it helped identify the biggest bottlenecks causing frustration on both sides.
04
User Survey
In this case, the survey had mixed purposes: to gather qualitative insights and measure satisfaction at each step of the process. Sent to both employees and customers, it helped identify the biggest bottlenecks causing frustration on both sides.
05
Service Blueprint
We mapped the As-Is Service Blueprint for each advertiser to visualize steps, touchpoints, pain points, and opportunities. After validating with clients, it clearly showed how many unnecessary steps people take just to complete simple tasks.
05
Service Blueprint
We mapped the As-Is Service Blueprint for each advertiser to visualize steps, touchpoints, pain points, and opportunities. After validating with clients, it clearly showed how many unnecessary steps people take just to complete simple tasks.
05
Service Blueprint
We mapped the As-Is Service Blueprint for each advertiser to visualize steps, touchpoints, pain points, and opportunities. After validating with clients, it clearly showed how many unnecessary steps people take just to complete simple tasks.
06
User Story Mapping
Based on the to-be narrative, we mapped the future journey showing how employees and customers interact, with features listed under each step to support it. Then we prioritized those features to define the MVP.
06
User Story Mapping
Based on the to-be narrative, we mapped the future journey showing how employees and customers interact, with features listed under each step to support it. Then we prioritized those features to define the MVP.
06
User Story Mapping
Based on the to-be narrative, we mapped the future journey showing how employees and customers interact, with features listed under each step to support it. Then we prioritized those features to define the MVP.
07
Kano Survey & Prioritisation Matrix
We tested only the features with unclear timing, which is why the “Must-be” quadrant remained empty. By asking users how they felt with and without each feature, and how important it was, we identified the right implementation order.
07
Kano Survey & Prioritisation Matrix
We tested only the features with unclear timing, which is why the “Must-be” quadrant remained empty. By asking users how they felt with and without each feature, and how important it was, we identified the right implementation order.
07
Kano Survey & Prioritisation Matrix
We tested only the features with unclear timing, which is why the “Must-be” quadrant remained empty. By asking users how they felt with and without each feature, and how important it was, we identified the right implementation order.
08
UX Metrics Workshop
To track product success and user satisfaction, we ran a workshop with stakeholders to define UX metrics using Google’s “Goal - Signal - Metric” framework. We also chose measurement methods and aligned on next steps for baseline tracking.
08
UX Metrics Workshop
To track product success and user satisfaction, we ran a workshop with stakeholders to define UX metrics using Google’s “Goal - Signal - Metric” framework. We also chose measurement methods and aligned on next steps for baseline tracking.
08
UX Metrics Workshop
To track product success and user satisfaction, we ran a workshop with stakeholders to define UX metrics using Google’s “Goal - Signal - Metric” framework. We also chose measurement methods and aligned on next steps for baseline tracking.
Outcomes
Outcomes
Outcomes
Automated most of the manual steps;
Reduced the number of steps in the workflow by half;
Enabled employees to be experts and advisors, not just middlemen.
Automated most of the manual steps;
Reduced the number of steps in the workflow by half;
Enabled employees to be experts and advisors, not just middlemen.
Automated most of the manual steps;
Reduced the number of steps in the workflow by half;
Enabled employees to be experts and advisors, not just middlemen.